![]()
 Research from the past two decades has revealed that minority communities in urban centres are more likely to be exposed to pollution and poor environmental conditions in general. In new research Yushim Kim and Yongwan Chun used scores to measure pollution and environmental effects in Southern California. They find that Hispanic and Asian communities are more likely to be exposed to pollution, but that as the proportion of Hispanics in area increases, the likelihood of the environment being poor begins to fall after a point. They argue that those studying environmental injustice should start to look more closely at how they measure risk and the analytical approach they use.
Southern California has been a fertile ground for environmental justice studies because of the historical and ongoing struggle with pollution problems, as well as minority and low-income communities’ increased concern about pollution and health risks. Los Angeles remains the city with the most persistent air pollution in the country (including the worst ozone pollution). The majority of the population of 10 million are White (approximately 50 percent), while African Americans comprise approximately 8 percent, and 14 percent are Asians. Hispanics and Latinos of any race constitute 48 percent of the population. Previous studies about Southern California environmental justice in the late 1990s and early 2000s presented consistent evidence that minority residents tend to disproportionately bear environmental risks.
Because three decades have passed along with California’s attentive policy efforts to address environmental injustice, we examined whether environmental inequity still remains in Southern California. To do this, we used the most recent data from the California Environmental Protection Agency’s (EPA) CalEnviroScreen tool which plots pollution impacts across census areas, or tracts.
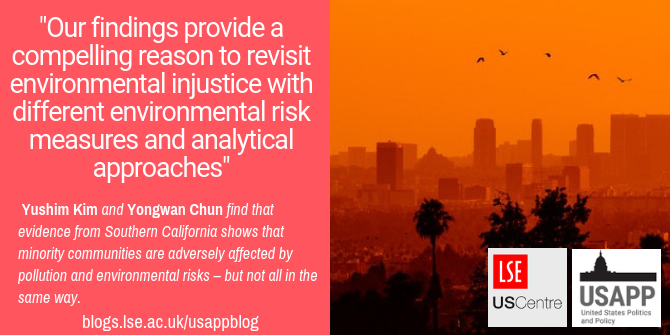
Photo by Josh Rose on Unsplash
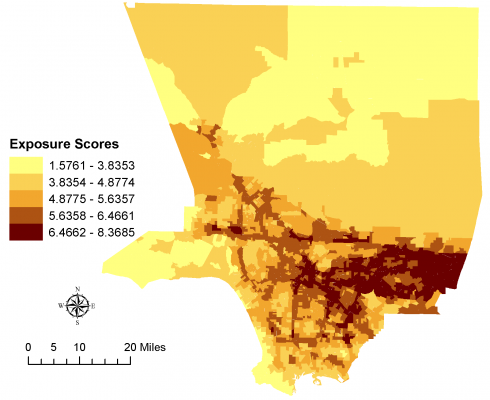
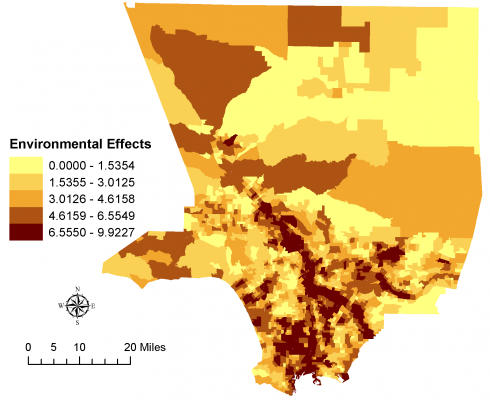
We tested two separate composite scores of environmental risks using the CalEnviroScreen dataset. The exposures score is calculated based on the seven exposure indicators that “people may be exposed to a pollutant if they come [in]to direct contact with it, by breathing contaminated air” (California EPA, p. 10). The environmental effects score is calculated in order to measure adverse environmental conditions using the five indicators that include “environmental degradation, ecological effects and threats to the environment and communities (p. 10).” Figure 1 shows the environmental risk scores in each census tract in Los Angeles county: the higher the score, the higher the environmental risk. Figure 1 also suggests that the environmental risk scores are not spatially independent; so we need to use a spatial model. Our test involves how these environmental risk measures are associated with minority status in census tracts in Los Angeles County.
Figure 1 – Pollution impact scores in Los Angeles County
(a) Exposures (The risk of being exposed to pollutants)
(b) Environmental Effects (The risk of living near adverse environmental conditions)
We found that the risk of being exposed to pollutants (e.g., ozone, PM2.5, and others) increases with an increase in Hispanic or Asian population within a given area. This result was consistent and robust regardless of analytical decisions about how to measure environmental risk and which analytical model we chose. However, the risk of living in adverse environmental conditions (e.g., hazardous facilities, ground water threats, and more) and race and ethnicity was less clear. When we examined environmental inequity using a conventional model, the risk rose as the percentage of Hispanics increases in a census tract. However, we found no similar links when we used a spatial model where the model assumes that environmental risk proportionally increases as the percentage of a minority increases. Instead, as the percentage of Hispanics in a census tract increases, the environmental risk increases to a point, and then decreases (see Figure 2).
Figure 2 – Relationship between the environmental effects score and the percentage of Hispanics
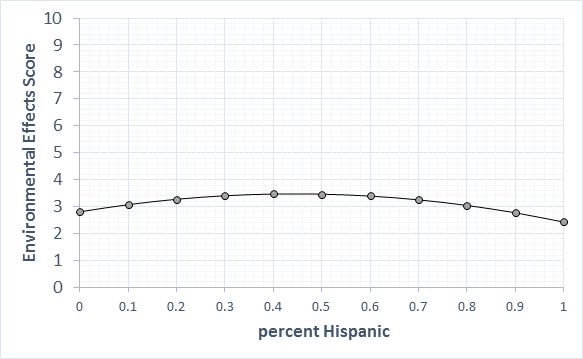
Note: Estimates of other variables are controlled in the intercept value
Some Hispanic communities may enjoy better environmental conditions—living near fewer hazardous facilities and having fewer ground water threats, among others—than do ethnically mixed communities. In our prediction based on the spatial model, ethnically mixed communities (with approximately 40 percent~50 percent of Hispanics) experience a higher risk of living near adverse environmental conditions in Southern California than do predominantly Hispanic communities.
The answer to the question of “who bears the environmental risk more in Southern California” depends upon the types of environmental risk and communities under scrutiny. At present, the risk of exposure to such pollutants as ozone, PM2.5, and toxic releases, and others increases as the percentage of Hispanics increases in a census tract. The robust findings of environmental inequity in Hispanic or Asian populations—especially in our exposures score—are troubling from the point of view of environmental policy. The risk of living near poor environmental conditions is more complicated than the risk of exposure to pollutants. The finding of the later risk indicates that if policy needs to be developed and updated accordingly in order to reflect changing environments, this new evidence directs urban environmental injustice research to pay close attention to ethnically mixed communities.
Our findings provide a compelling reason to revisit environmental injustice with different environmental risk measures and analytical approaches. Future research is needed in order to know better understand how ethnically similar communities came to live in areas of decreasing environmental risk (e.g., the role of social cohesion, technologies in organizing for collective action).
At the same time, it suggests that addressing environmental inequity may be like pushing a balloon: for equity improvements in at least one area of environmental risk (i.e., the risk of living near adverse environmental conditions) for one community, but this is now causing trouble in another community type (i.e., mixed communities). The issues of social justice and the distress that indications of environmental injustice bring to some groups are sufficiently significant that environmental justice researchers should consider the implications of environmental risk measurements and spatial dependence in the design of their studies.
- This article is based on the paper, “Revisiting Environmental Inequity in Southern California: Does Environmental Risk Increase in Ethnically Homogeneous or Mixed Communities?” in Urban Studies.
Please read our comments policy before commenting.
Note: This article gives the views of the authors, and not the position of USAPP – American Politics and Policy, nor the London School of Economics.
Shortened URL for this post: http://bit.ly/2VBT8xP
About the authors
![]() Yushim Kim – Arizona State University
Yushim Kim – Arizona State University
Yushim Kim is an associate professor at the School of Public Affairs at Arizona State University and a co-editor of Journal of Policy Analysis and Management (environmental policy). Her research examines environmental and urban policy issues and public health emergencies from a systems perspective and tools.
Yongwan Chun – University of Texas at Dallas
Yongwan Chun is an associate professor of Geospatial Information Sciences program at the University of Texas at Dallas. His research interests lie in spatial statistics and GIS focusing on urban and economic issues including population migration, commuting, and urban crime.