In t he United States, individual states control how US House districts are apportioned: in some the legislature creates these maps, while in others this is done by independent redistricting commissions. Ahead of the redistricting process which will follow the 2020 census, Ryan D. Williamson looks at how the methods used by states to redraw district lines effects electoral competitiveness. He finds that states which use maps drawn by redistricting commissions and state courts are more likely to have more and better quality candidates, and fewer incumbents, running for the US House.
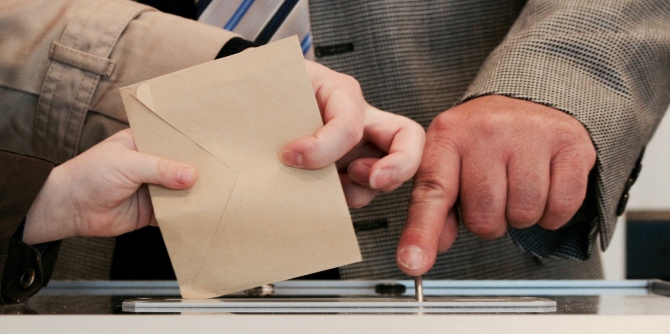
As the 2020 Census grows closer, reapportionment and the redistricting process becomes an increasingly important issue. States that gain or lose seats in the House of Representatives due to population changes must construct largely (or entirely) new maps. Even states that keep their current number of seats will need to ensure that district populations are comparable enough in number to maintain legality, which would likely require at least tweaking the existing lines.
However, not every state draws districts the same way. These different methods of redistricting can produce different effects on election outcomes within states. Many states allow the state legislature to produce their congressional maps. States where one party controls both chambers of the legislature and the governorship can pass redistricting maps that favor their party without much opposition. States where control is not concentrated within one party still see maps infused with partisanship, but there are generally advantages to both parties.
Sometimes states cannot enact a plan that passes legal scrutiny because it dilutes the voting power of a particular group. In those cases, courts overturn the legislature’s map and construct new district lines themselves. The last method is a seldom used one—empowering a redistricting commission. These are bodies that (at least ostensibly) are not motivated by partisan concerns, and instead construct maps with other goals in mind like fostering competition and drawing more compact districts.
Some research shows that when states use redistricting commissions, we see greater electoral competitiveness in US House elections. Conversely, other research suggests that commissions are actually not much better at fostering competition.
In order to further examine the effects of varying redistricting methods, I look at how these different methods influence who decides to run in US House elections. Specifically, I look at the effects on quality candidate emergence, uncontested elections, and open seat races.

“Public Hearing on the Legislative Redistricting Plan” by Maryland GovPics is licensed under CC BY 2.0
First, I examine the number of elections in which a quality candidate decided to run for a US House seat. Quality candidates are those who have previously held some form of elective office, which means they possess the knowledge and skills necessary to win an election. More importantly, they generally have the political savvy to know when their chances of winning are the highest and capitalize on those chances. This background and skillset typically translate in greater levels of success for these kinds of candidates.
From Figure 1, we see that different means of constructing maps can have an effect on the decision of quality candidates to run for a US House seat. Specifically, plans passed under unified control of government witness only 27.2 percent of races featuring a quality candidate. This is the lowest figure and likely a product of mapmakers being motivated by their partisanship in a state where the opposition party is powerless to intervene. Whenever the minority party does have a say, as we see with plans drawn under divided control of government, there is a slight uptick to 30.2 percent.
Figure 1 – Proportion of Quality Challengers by Redistricting Method

This number substantially increases whenever state legislatures are removed from the redistricting process. Court-drawn plans witness quality candidates emerge in almost one-third of races (32.7 percent). Furthermore, commissions produce maps that feature 37.4 percent of races fielding a quality candidate. This represents a more than 10 percentage-point increase from the most partisan redistricting plans.
A similar relationship is seen in Figure 2, which shows the proportion of elections which featured only one candidate across each redistricting method. Legislative-based plans produce the highest numbers of uncontested races. Specifically, partisan maps and bipartisan maps see 14.1 percent and 13.3 percent of races go uncontested, respectively. However, this number decreases to 10.8 under court-drawn maps and further still to a mere 3.8 percent when commissions are responsible for redistricting.
Figure 2 – Proportion of Uncontested Races by Redistricting Method

Finally, I examine the proportion of open seat races across redistricting methods. This is depicted in Figure 3. If incumbents feel safe, they are less likely to retire, and partisan mapmakers are more likely to feel safe when districts were constructed in their party’s favor, which is often the motivating factor behind legislative-based redistricting plans.
Figure 3 – Proportion of Open Seat Races by Redistricting Method

This is especially true under divided control of government where both parties create a map which benefits their respective incumbents. Indeed, only about 1 in 10 races do not feature an incumbent in these cases. On the other hand, this number nearly doubles when commissions are responsible for drawing district lines.
Taken together, these numbers provide evidence in support of the argument that taking the redistricting process out of the hands of the state legislature can increase the competitiveness of US House elections.
Redistricting plans drawn at the beginning of the decade can impact elections many years after. Therefore, it becomes important to understand the effects each different method has on election outcomes. My research shows that allowing state legislatures to construct district maps reduces the overall level of competitiveness by deterring stronger, quality challengers and allowing incumbents to more easily win reelection.
- This article is based on the paper “Examining the Effects of Partisan Redistricting on Candidate Entry Decisions” in Election Law Journal: Rules, Politics, and Policy.
Please read our comments policy before commenting.
Note: This article gives the views of the author, and not the position of USAPP – American Politics and Policy, nor the London School of Economics.
Shortened URL for this post: http://bit.ly/2H4vX8b
About the author
Ryan Williamson – Auburn University
Ryan Williamson is an Assistant Professor in the Department of Political Science at Auburn University. He received his PhD from the University of Georgia, and previously worked on Capitol Hill as a member of the American Political Science Association’s Congressional Fellowship Program. His interests include Congress and Legislative Procedure, Congressional Elections, Institutional Development, the US Presidency, and Research Design and Methods.