 The Towns Fund is a scheme designed to support towns across England, particularly those with high levels of income deprivation. Chris Hanretty takes a look at the selection of towns invited to bid for funding under the scheme. He finds that the funding decisions were driven by party-political considerations, not by need.
In July of last year, Boris Johnson announced a scheme (“the Towns Fund”) to improve towns across England. In September, the Ministry of Housing, Communities and Local Government published a list of 101 towns specially selected to bid for a tranche of this funding. Journalists and opposition politicians were quick to realise that many of the chosen towns were in Conservative marginals. The speculation led to a National Audit Office (NAO) report and an inquiry by the Public Accounts Committee. This scrutiny is entirely warranted: my analysis of the scheme suggests strongly that it was party-political considerations, not merit, which determined which towns were chosen.
The selection of towns started with a long-list of 541 towns in England (excluding London) which civil servants had identified as having higher-than-average levels of income deprivation. Civil servants scored these towns, sometimes using quantitative measures (skills deprivation, income deprivation) and sometimes qualitative measures (suitability for future investment, alignment with other government programmes). Each English region was given an initial allocation of towns, and towns within each region were grouped into high, medium, or low-priority bands. Ministers agreed to fund all of the towns in the high-priority group, but exercised discretion over the selection of towns in the medium- and low-priority groups. The list of towns considered, together with their scores and associated ranks, was published in a NAO report earlier this year.
“Towns” aren’t a common administrative unit, and it takes some work to relate towns to Westminster constituencies. Formally, towns are built-up areas, or subdivisions of built-up areas, and the ONS makes boundary files of these built-up areas freely available. By merging these boundary files with boundary files for Westminster constituencies, we can identify which towns were located either in whole or in part in Conservative-held seats at the time the selection decisions were made.
Figure 1: Boundaries for two towns (black) and their surrounding Westminster constituencies (dotted blue).

Figure 1 uses these boundary files to chart two towns. On the left, we see Glastonbury, wholly contained within the boundaries of Wells. On the right, we see Skegness, which is split between the constituencies of Louth and Horncastle and Boston and Skegness (both Conservative-held). I’ll refer to both of these towns as “Conservative-held”, even though this description catches some towns with some Labour or Lib Dem representation. When I talk about the Conservative majorities in these towns, I’ll take either the sole Conservative majority (for towns contained in a single seat) or the average of the Conservative majorities.
Baseline data – seats
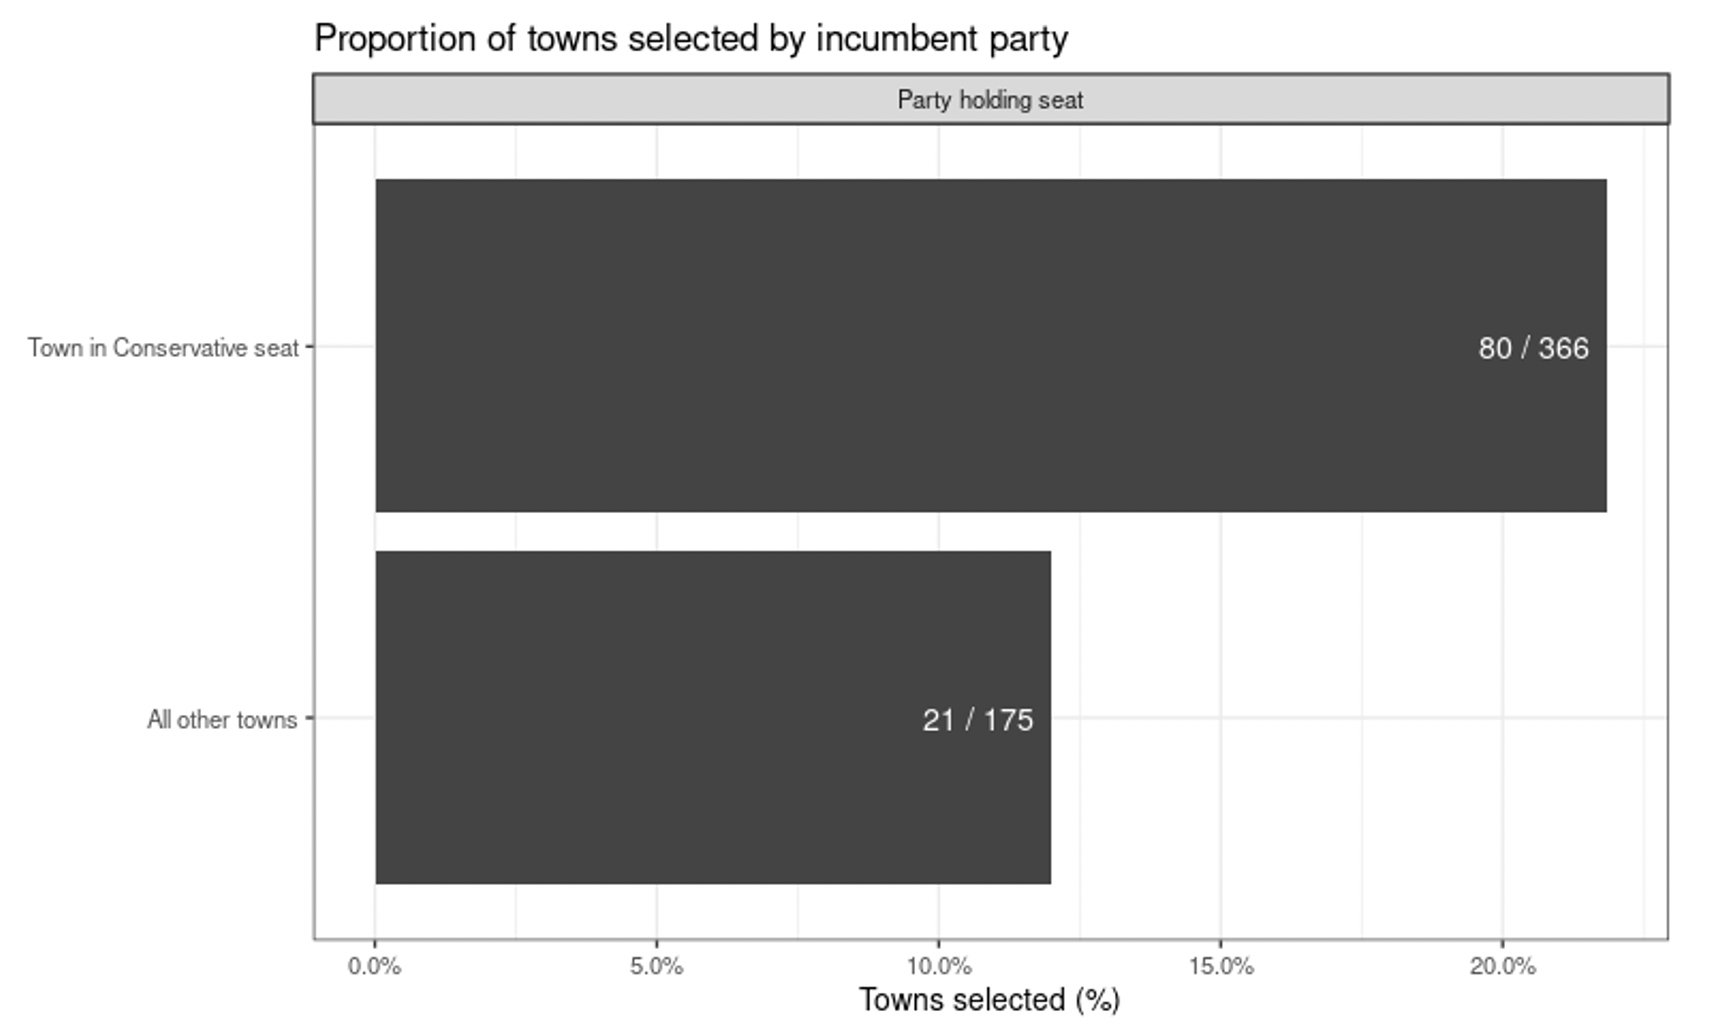
A first pass at the data shows that “Conservative-held” towns were much more likely to receive funding. Figure 2 below shows that the success rate for Conservative towns was ten percentage points higher than the rate for all other towns, and very close to twice as high.
Figure 2: Success rates according to whether or not the town was Conservative-held.
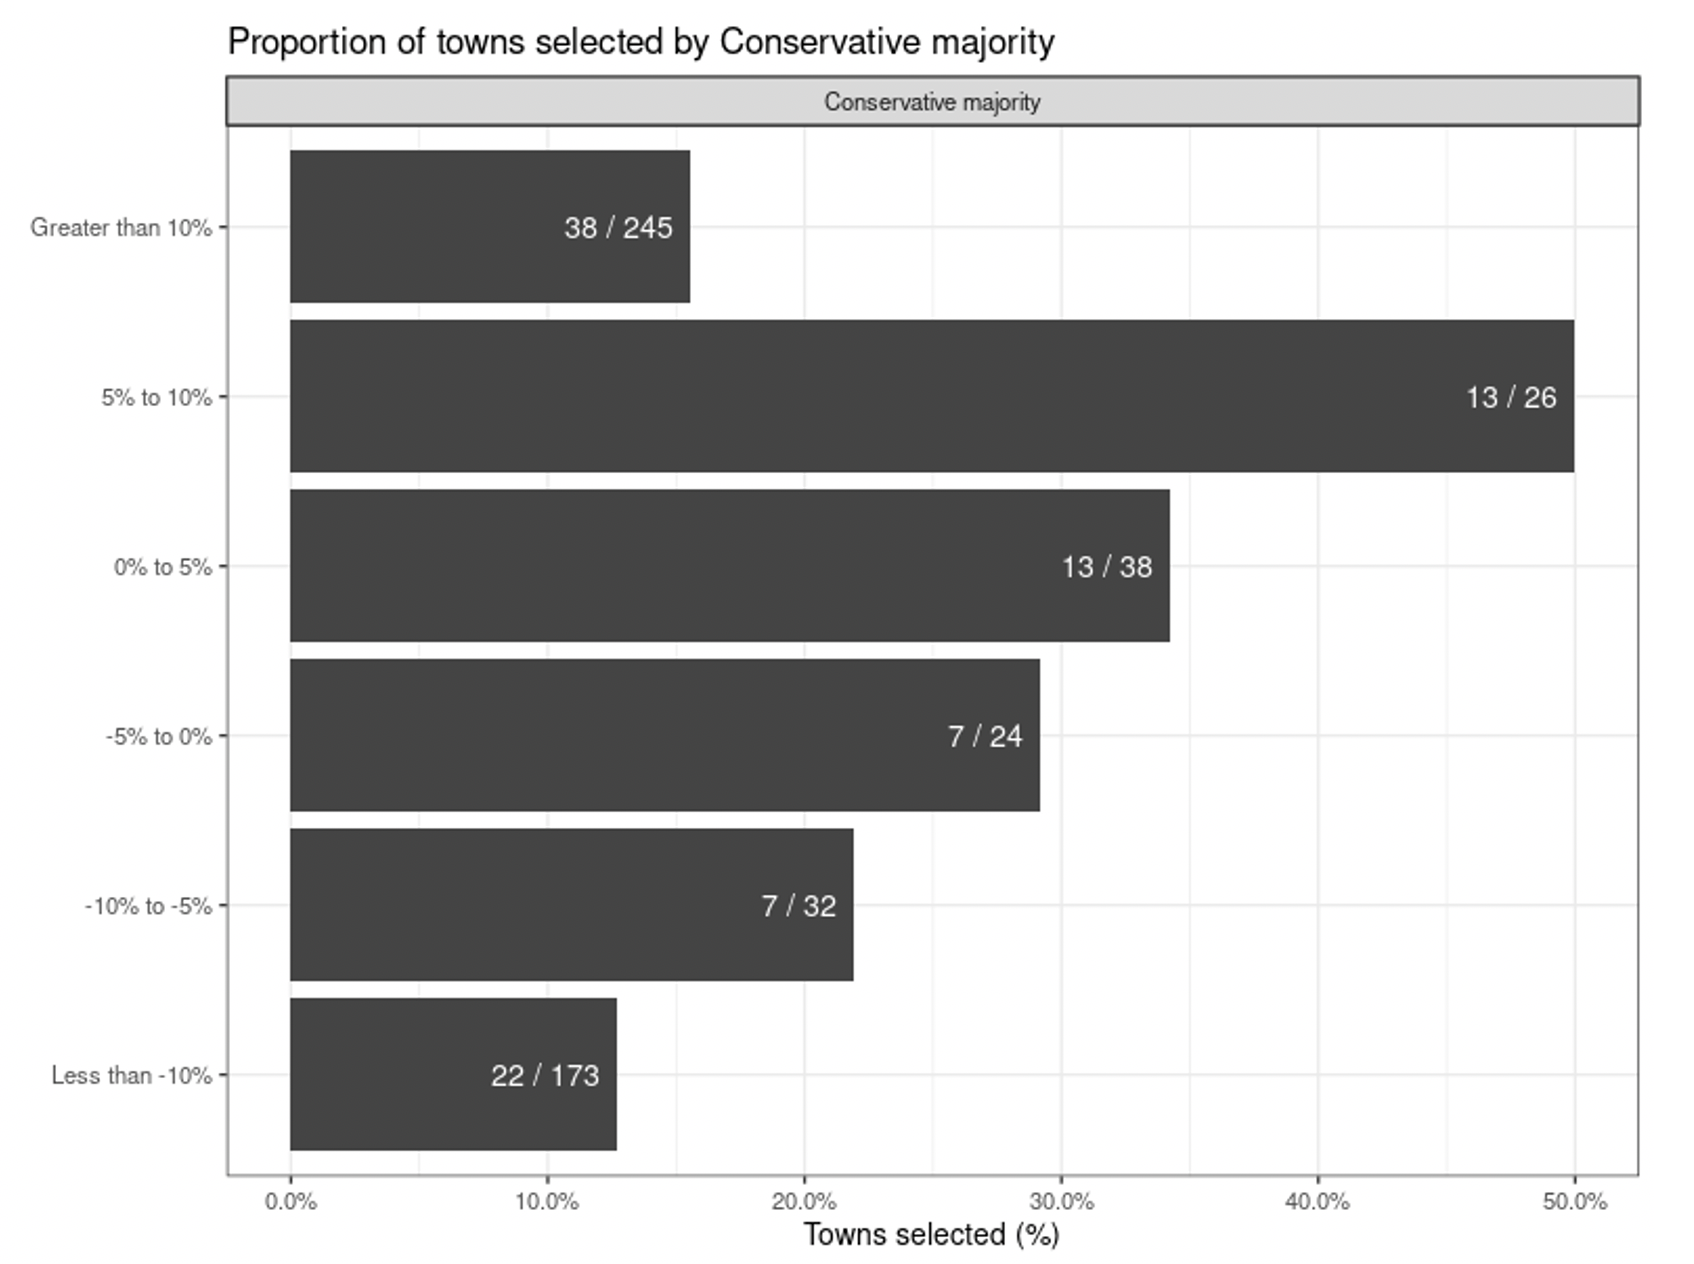
The category of “Conservative-held towns” includes towns with very different characters. It runs the range from Stockport to the town of Holbeach, which is in the wonderfully named constituency of South Holland and the Deepings, and which has the largest Conservative majority in the country. It’s because of this (electoral) diversity that Figure 3 below shows the success rates for towns according to the size of their Conservative majority. When the Conservative majority is very large, success rates are more or less average. It’s only when we move into marginal Conservative towns that the success rates spike. Spending isn’t entirely focused on Conservative held seats – Conservative targets (seats where the Labour or Lib Dem majority is less than 5%) have higher success rates than safe Conservative towns.
Figure 3: Success rates by size of Conservative majority.
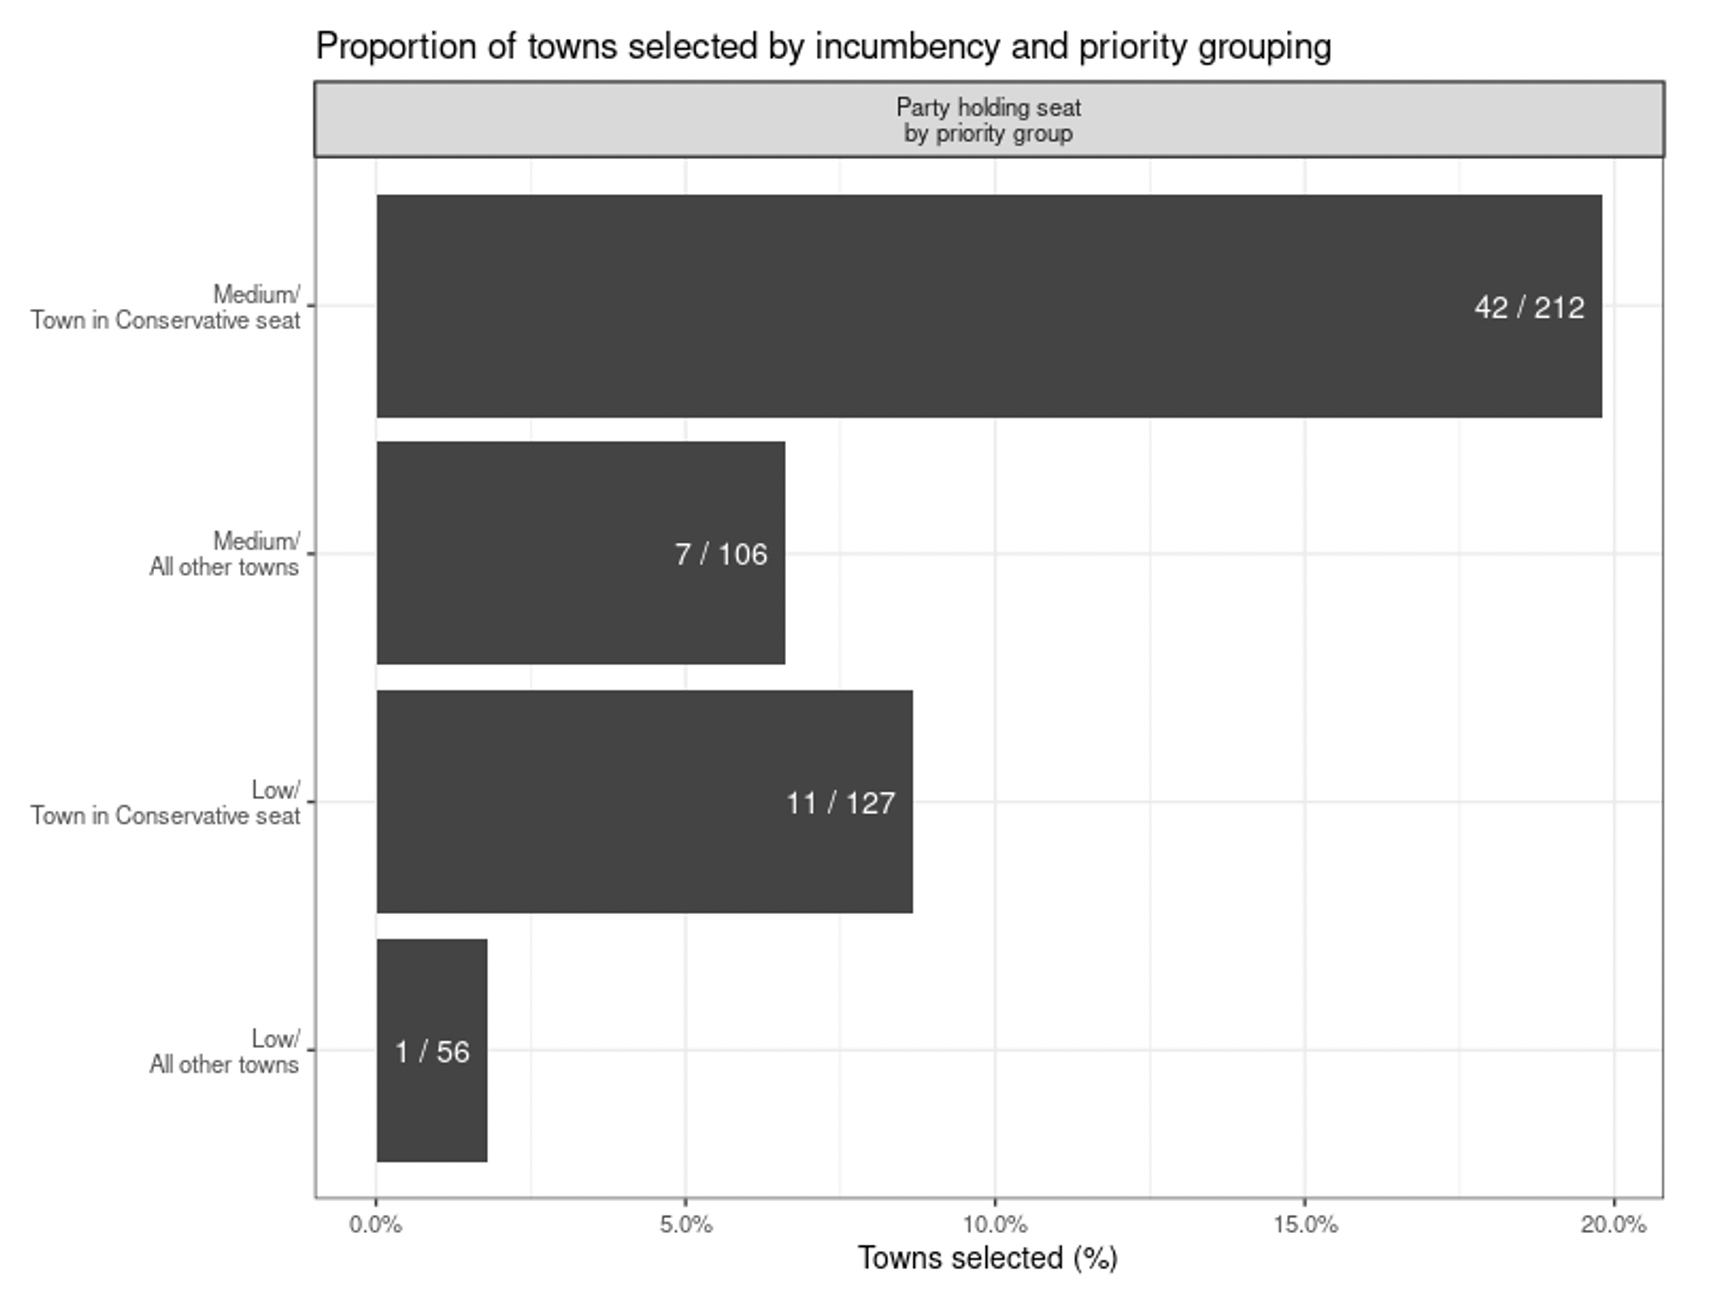
These patterns do not provide conclusive evidence that party-political considerations determined the choice of towns. It’s possible that those towns which were most deserving (on the basis of the criteria assembled by civil servants) just happened to also be Conservative marginals. Figure 4 shows this isn’t the case. This figure breaks down success rates by whether a town was Conservative-held or not, and by the priority grouping the town was placed in. As the graph shows, the success rate for Conservative-held towns in the low priority group was actually higher than the success rate for all other towns in the medium priority group. The bias in favour of Conservative-held towns was sufficiently large to over-turn civil service recommendations not just on fine distinctions within broad categories but concerning the drift of the scheme as a whole.
Figure 4: Success rates by incumbency and priority grouping.
Of course, it’s possible that ministers used the same criteria that civil servants used, just in a slightly different way. Civil servants placed weights on a range of criteria to come up with the scores used in the ranking. But it’s possible that ministers (for example) placed greater weight on future investment opportunities and alignment with broader government policies than the criteria measuring skills and income deprivation. In order to test this possibility, I ran a series of regression models, trying to predict town selection on the basis of the town’s rank, and whether or not it was in a Conservative held seat. Altogether, I ran 127 regression models covering all possible combinations of the criteria used in the scheme. In every single one of these models, the effect of being in a Conservative-held seat was positive and significantly different from zero. The patterns shown in Figure 4 can’t be explained by different ways in which ministers used civil service supplied figures.
Although the selection of towns seems to have been driven, in a strong and clear way, by electoral considerations, that doesn’t mean that it brought the Conservative party any electoral benefit. When I model the 2019 Conservative vote share in English regions outside of London, controlling for 2017 Conservative vote share and incumbency and the number of (eligible) towns in each seat, I find that seats with selected towns had Conservative vote shares that were 0.22 percentage points higher, but this effect wasn’t significantly different from zero, and could well have been between -0.56 percentage points and 0.99 percentage points. The evidence that towns benefitted from being in Conservative seats is therefore much stronger than the evidence that the Conservatives benefitted from selecting towns.
On the basis of the data collated by the ministry and published by the NAO, there is robust evidence that ministers chose towns so as to benefit the Conservatives in marginal Westminster seats. This evidence is robust in the sense that the effects persists even when controlling for other town characteristics that might justifiably affect selection. Choosing towns to benefit a particular party goes against the seven principles of public life (the ‘Nolan principles’), and in particular the obligation to “take decisions impartially, fairly and on merit, using the best evidence and without discrimination or bias”. These decisions should therefore be examined both by the Public Accounts Committee and (since the decisions potentially involve a breach of the Ministerial Code, which incorporates the Nolan principles) by the Cabinet Office upon referral by the Prime Minister.
____________________
About the Author
Chris Hanretty is Professor of Politics at Royal Holloway, University of London, and co-director of the Democracy and Elections Centre there. His research deals with representation of local opinion and judicial behaviour. His book, A Court of Specialists: Judicial Behavior on the UK Supreme Court, was published by Oxford University Press in 2020.
Photo by Jan Antonin Kolar on Unsplash.