 The 1964 election marked the beginning of a prolonged decline in presidential election turnout lasting through the 1990s. Recent analysis of American presidential election turnout from 1952 to 2020, however, reveals an increase previously expected by election scholars. In new research, Francine Romero and David Romero find that the downturn, while real, masked phenomena which were, in the background, pushing turnout upward. The phenomena, ironically, are those many see as harmful to American democracy: polarization, and, negative presidential campaign advertising.
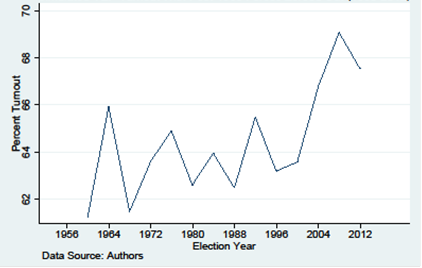
In the 2020 presidential election, nearly two-thirds of eligible voters turned out to vote, a proportion not seen in over a century. And while voter turnout, on the whole, has had an upward trajectory over the past 60 years, there have also been marked declines over this period. Figure 1 below shows turnout in American presidential elections from 1952 through 2020, as measured by the voting eligible population (VEP).
Figure 1 – VEP Turnout in American presidential elections
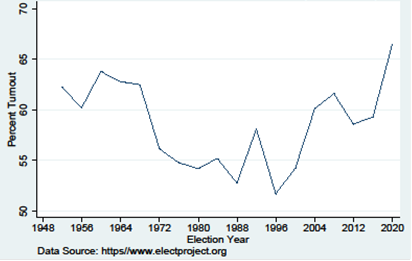
Figure 1 shows turnout’s unsteady, but upward trend up to 1960. From there, however, turnout took a prolonged downward plunge though the 1996 election (with the noticeable exception of 1992). Much has been written to offer an explanation for the individual decision not to turn out to vote. Relying on individual-level, national survey data sources (e.g., the University of Michigan’s American National Election Studies series), researchers have offered a wide array of explanations for this diminished propensity to vote from the 1960s to the 1980s (e.g., declines in: efficacy, trust, newspaper reading, group membership, etc.).
Recent investigations using national-level elections data have updated our understanding of the trends in turnout’s trajectory. Returning to Figure 1, it is apparent that presidential election turnout looks very different now that it did when scholars began investigating its downturn. By the end of the 1980s it appeared turnout’s downward plunge had been replaced by wild, but possibly flattened fluctuations. Indeed, the turnout literature describes that the decline in presidential election turnout ended in 1972, after which it flattened through 2000.
Modelling the drivers of presidential election turnout
Again, referring to Figure 1, however, it is clear that American presidential election turnout has been on a noticeable upswing starting with the 2000 election, so the description at least needs updating. Our analyses reveal turnout’s two key features: its downward shift, timed as a post-1968 interruption; and its steady increase obscured by the downward shift. Controlling for that shift, turnout increased by about 11.9. percent over the 1952 through 2020 elections. But, if turnout has taken an upward swing, what is driving that explanation? Figure 2, given below, offers answers.
Figure 2 – Drivers of national presidential election turnout
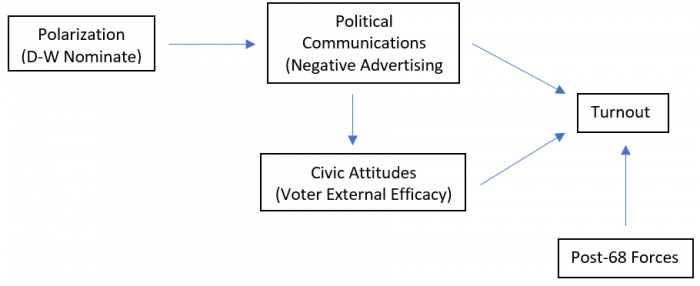
The upward trend is an indirect outcome of political polarization. The effect is indirect because polarization provides the atmosphere in which presidential elections play out. As such, it provides the impetus for what we presume are direct and positive influences on turnout: negative presidential campaign advertising and voters’ beliefs about the extent that their participation affects government behaviors (known as voter external efficacy). Our model examines the 1960 through 2012 elections, the elections where negative advertising data is available.
Our model finds that polarization has a positive influence on – i.e., it leads to more – negative presidential advertising. In turn, negative presidential campaign advertising has a negative influence on voter external efficacy, and negative presidential campaign advertising and voter external efficacy both have a positive influence on turnout. In addition, negative advertising and external efficacy are estimated to have, statistically speaking, identical turnout influences. A one percent increase in either increases turnout by a little over a quarter of a percent. Finally, post-1968 social forces – such as the 26th Amendment which lowered the voting age to 18 – are estimated to have dropped turnout by about nine percent.
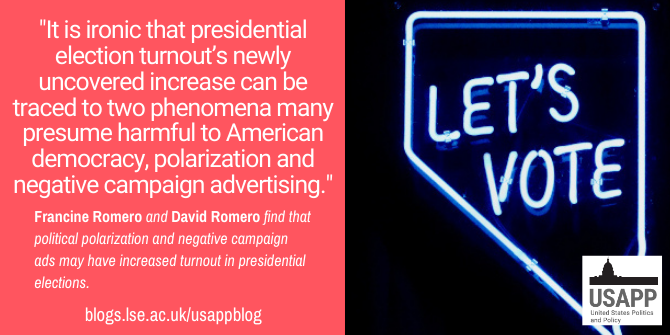
Photo by Manny Becerra on Unsplash
Of even greater interest is how these phenomena contributed to turnout’s estimated 6.1 percent increase over the 1960 through 2012 elections. In order to isolate the combined affect negative presidential campaign advertising and voter external efficacy had on turnout’s increase, the post-1968 turnout drop is zeroed out, thus giving their combined influence as if the post-1968 drop had not occurred. This estimate is given in Figure 3 below.
Figure 3 – Simulated VEP turnout with post-1968 forces zeroed out
The simulated trend suggests turnout increased on average by a little over a third of a percent for each election from 1960 to 2012. This calculates to an increase of about 4.7 percent over that period. Another way to estimate the increase is to take the difference between the endpoint estimates for the period: 61.2 percent for 1960, and 67.5 percent for 2012. This suggests an increase of about 6.3 percent. The endpoints difference is greater because it is influenced more by the sharp increase over the 2004 through 2012 elections, while the average estimate is influenced more by turnout’s relatively flat turnout projection between the endpoint estimates. Either way, negative presidential campaign advertising and voters’ beliefs about the extent that their participation affects government behaviors are estimated to have had a significant influence on turnout’s increase.
Negative campaign advertising and external efficacy, their separate affects
Finally, it is also possible to separate these factor’s contributions to turnout’s estimated increase. From 1960 to 2012 they trended in different directions: negative advertising increased steeply, and external efficacy decreased steeply. However, because negative advertising increased more steeply than efficacy decreased, their combined turnout affect is positive. Negative advertising is estimated to have increased turnout by about 13.3 percent, while external efficacy is estimated to have decreased turnout by about 8.6 percent – making the 4.7 percent overall increase.
It is ironic that presidential election turnout’s newly uncovered increase can be traced to two phenomena many presume harmful to American democracy, polarization and negative campaign advertising. The model offered to support this claim is not the only, or even possibly the best, one to pursue this question. It may however introduce a new investigatory tack for understanding American presidential election turnout.
- This article is based on the paper “National Presidential Election Turnout: 1952 to 2020,” recently published in American Politics Research.
Please read our comments policy before commenting.
Note: This article gives the views of the author, and not the position of USAPP – American Politics and Policy, nor the London School of Economics.
Shortened URL for this post: https://bit.ly/3CjE9Ko
About the authors
Francine Sanders Romero – University of Texas at San Antonio
Francine Sanders Romero is an Associate Professor and Chair of the Public Administration Department at the University of Texas at San Antonio. She is a political scientist with areas of interest bridging political behavior and institutions. Her recent publications have appeared in State and Local Government Review and Journal of Social Science History.
David W. Romero
David W. Romero is a retired Associate Professor of Political Science, specializing in American Electoral Behavior. His work has appeared in journals including Political Behavior and Presidential Studies Quarterly.