 In the spring of 2020, in addition to the COVID-19 public health emergency, US state governments were also facing budgetary crises as revenue sources such as sales and fees fell as lockdowns began. Using North Carolina as a case study, Whitney Afonso looks at municipalities’ budget strategies in the face of falling revenues. Rather than following best practice by investing in infrastructure, she finds that local governments primarily used similar measures as in past recessions such as cancelling or delaying large projects, reducing staff and accessing existing savings.
For many states the impact of the COVID-19 pandemic began in March 2020, which also coincided with when state and local governments were in the middle of preparing their budgets for the next fiscal year (2020-2021) which typically begins July 1st. The “Great Lockdown” led to rapid increases in unemployment, tourism coming to a halt, school closures, and commuters working from home. These changes meant that almost overnight, sales, occupancy, meals, and other taxes and fees dropping well below forecasted levels for the current fiscal year, leaving government officials scrambling to prepare a balanced budget for the following fiscal one. The crafting of the following year’s budget was especially challenging because of the uncertainty of how long the pandemic would last and how much it would impact revenues and the need for services—and because governments often use the previous recession as a benchmark for the current one.
How did local governments budget in the face of reduced revenues?
This strategy, while adequate in most periods, was problematic because of the nature of the Great Recession (the severity, the duration, and the impact on property taxes) and because the Great Lockdown was a different animal altogether. Thus, it is important to not just understand what the fiscal year 2020-2021 budget will end up looking like after midyear adjustments, but to also understand the choices that local governments made to cope with the coming, but not yet realized, recession brought on by the pandemic. Would local governments employ different strategies? Rely on best practices more heavily?
Using a survey of counties and municipalities in North Carolina in April of 2020, I find that local governments were conservative in their revenue estimations but relied on the same basic strategies that we have seen them use in previous recessions like cancelling and delaying capital and infrastructure projects, spending down fund balances (savings), and making reductions to staffing.
Given the unique opportunity local governments had to budget for a recession that had not yet occurred, it was an opportunity to see if they would utilize more best practices when it came to managing financial resources during a recession. Those best practices are to use savings that are accrued during periods of economic growth to smooth expenditures without raising taxes and to increase infrastructure spending (while costs and interest rates are low).
Differing pandemic effects across types of local taxation
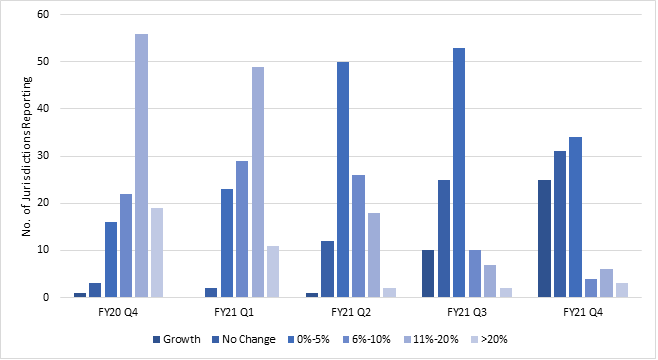
In North Carolina, the majority of local governments heavily rely on property and sales taxes. Municipalities also rely on utility fees for a great deal of their revenues. While occupancy (or hotel) taxes require approval from the state’s general assembly they are also widespread in the state. The anticipated impact of these revenue streams varied tremendously. As shown in Figure 1, the majority of local governments forecast that the end of fiscal year 2020 would end in a shortfall of 11-20 percent of the expected sales tax revenue and that the start of the next fiscal year would also have larger shortfalls than previously forecasted. However, local governments were also optimistic that the impact on sales taxes would be relatively short lived and that by the Spring of fiscal year 2021 (Q4), there would be growth, met expectations, or very low shortfalls.
Figure 1 – Expected Reduction in Sales Tax Revenue: Municipal and County
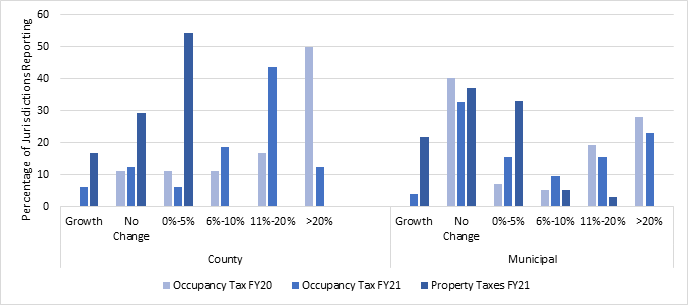
Despite the fact that sales taxes received a great deal of attention during the pandemic, and rightfully so, they are only one of several key revenue sources. Property taxes and occupancy taxes are also critically important to the majority of jurisdictions in the state. Figure 2 shows how local governments were forecasting those would perform. Not surprisingly, property taxes were not expected to fall significantly for counties or municipalities. Property taxes tend to be very stable, even during recessions, and the reassessments (if any were done) for the following fiscal year had been performed already, so there would not be an expected drop in property taxes.
You may ask yourself, then why did any local governments forecast reductions in expected property taxes? The answer is simple: concern over reduced collections. Occupancy taxes, unsurprisingly, tell a different story. Occupancy taxes were expected to plummet for fiscal year 2020, especially for counties, and to fall on average by between 11-20 percent for counties and by less for municipalities. Occupancy taxes are typically vulnerable during recessions, but with the pandemic bringing tourism to halt, rather than just reducing people’s incomes—it is not surprising that local governments were bracing themselves for large reductions.
Figure 2 – Expected Reductions in Occupancy and Property Taxes
Strategies to balance local budgets
Given that local governments expected substantial revenue shortfalls, how did they balance their budgets? If they were following best practices, we would see that local governments neither reduced expenditures nor increased revenues and ideally increased infrastructure expenditures. This could be accomplished by taking out debt (at low interest rates) for the capital and using savings to smooth spending. However, what we observe is that they used a mix of best practices and other common strategies. Figure 3 shows the most common strategies employed in preparing the fiscal year 2021 budgets for counties and municipalities. Although there is a great deal of overlap between the strategies between counties and municipalities there are also some notable differences. For example, municipalities were much more likely to close facilities than were counties. Some of this is because of the types of services provided by the two governments. However, counties were also notably more likely to spend down their savings (fund balance) than municipalities. We also see that counties are much more likely to have reduced capital expenditures than municipalities. While this is the opposite of what is considered a best practice, it is incredibly common financial management strategy during recessions. Figure 3 also shows that staffing reductions were some of the most common budget balancing choices. It is worth noting that the strategies employed largely protected current employees, i.e., no new positions and hiring freezes.

Photo by Michael Longmire on Unsplash
Figure 3 – Strategies to Balance the Budget in Response to Projected Revenue Shortfall

Lastly, are the departments that are most impacted by the budget shortfalls, presented in Figure 4. What we observe is that public safety expenditures tend to be the most protected and that parks, general government, and libraries tend to be the most vulnerable. These reductions are largely accomplished through staffing adjustments. What may surprise many is that many counties report substantial decreases to education. It is worth noting that in North Carolina the state is responsible for the operating costs of schools and the county is responsible for capital costs—so those reductions are primarily to capital.
Figure 4 – Areas of public expenditure most impacted by project revenue shortfall: counties

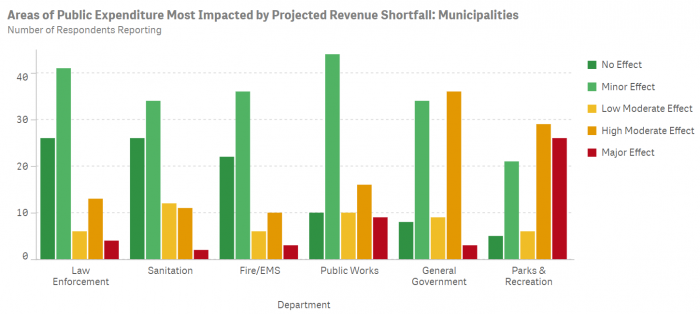
Figure 5 shows the primary departments for municipalities and how impacted their budgets were by the projected revenue shortfalls. A similar picture to the county budgets emerges. Public safety was largely protected, and general government and parks were the departments where the most substantial cuts were made. It is worth noting that one reason for the larger impact on parks and recreation budgets for municipalities and counties is shown in Figure 3, where municipalities had more ability and willingness to close facilities during the pandemic.
Figure 5 – Areas of public expenditure most impacted by project revenue shortfall: municipalities
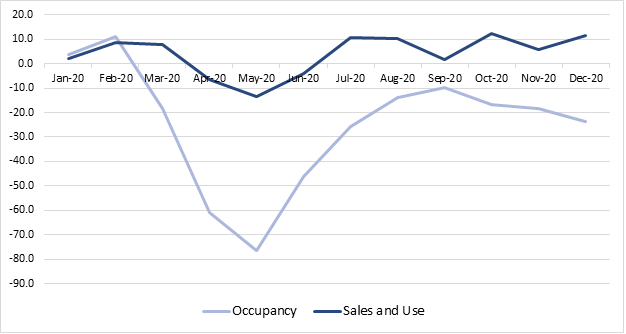
While we do not yet have the audited financial reports of what local governments actually ended up spending during fiscal year 2021, we do have some of the early numbers for revenues. In fact, for the two most impacted revenue sources reported here, sales and occupancy taxes, local collections have rebounded faster than anticipated. This is especially true for sales taxes, which actually experienced growth in the first half of fiscal year 2021, as shown in Figure 6. Not surprisingly, occupancy taxes have been slower to recover. We have also seen that there was an unequal recovery, with urban areas experiencing the rebound more slowly than many of their less populated counterparts. For example, tourism and travel rebounded much more quickly in the less densely populated mountain and beach communities in North Carolina (where many rent an entire house or apartment) than in the large cities like Charlotte and Raleigh.
Figure 6 – Percent Change in Year-Over-Year in Local Tax Revenues by Month in North Carolina
Ultimately, for local officials budget preparation for fiscal year 2021 ended up not being that different from what they did in previous recessions. Financial managers had less time to update forecasts and expenditures, but ultimately, they used the same strategies they had in the past. For revenues, they allocated fund balance and tended not to increase taxes or fees. For expenditures, they made staffing adjustments and reduced capital expenditures. That is not to say that this recession was like others, it was not, and there are examples of different choices such as municipalities closing facilities given the pandemic. Even with the examples of different strategies, it should leave those of us interested in financial management asking ourselves, why weren’t more best practices used and what can we do to encourage them in the future?
- This article is based on the paper, ‘Planning for the Unknown: Local Government Strategies from the Fiscal Year 2021 Budget Season in Response to the COVID-19 Pandemic’, in State and Local Government Review.
Please read our comments policy before commenting.
Note: This article gives the views of the author, and not the position of USAPP – American Politics and Policy, nor the London School of Economics.
Shortened URL for this post: https://bit.ly/3hwG06U
About the author
Whitney Afonso – University of North Carolina at Chapel Hill
Dr. Whitney Afonso is an Associate Professor at the School of Government at the University of North Carolina at Chapel Hill. Her research focuses on state and local public finance and has been published in journals such as Public Budgeting & Finance, Public Finance Review, National Tax Journal, Public Administration Review, Journal of Public Policy, and State and Local Government Review. Her article, “Leviathan or Flypaper: Earmarked Local Sales Taxes for Transportation,” received the Burkhead Award for best article published in Public Budgeting & Finance in 2015. Afonso earned a BA in political science from Vanderbilt University, and an MA in economics and PhD in public administration and policy from the University of Georgia.