A little over a year ago, the EU’s political leaders agreed on an unprecedented fiscal package – dubbed ‘Next Generation EU’ – to aid Europe’s recovery from the pandemic. Ricardo Hausmann (LSE), Miguel Angel Santos (Harvard), Corrado Macchiarelli (NIESR/Brunel/LSE) and Renato Giacon (European Bank for Reconstruction and Development) write that economic complexity theories can provide a useful tool for evaluating whether the recovery and resilience plans submitted by EU member states to receive this funding are well-designed. Assessing the case of Greece, they argue that investments should be tailored toward export-oriented sectors and aim to help close the country’s product complexity gap with other EU states.
There is increasing evidence that directing investments towards more complex and less ubiquitous products can help countries improve growth prospects, without undermining the importance of the accumulation of factors of production such as physical and human capital, or the role of institutional measures such as good governance and the rule of law. Complexity itself must build on a strong path dependence of incrementing each country’s past economic capabilities.
The EU Recovery and Resilience Facility (RRF), as the centrepiece of the Next Generation EU (NGEU) programme launched in July 2020, enshrines the twin priorities of a ‘green’ and ‘digital’ transition, focusing on raising the EU’s potential growth, improving long-term fiscal sustainability, and helping economic convergence across the Union, rather than achieving short-term fiscal stabilisation after the pandemic.
Could theories on economic complexity be used to assess the validity of the Recovery and Resilience Facility? We argue that the deployment of EU funds and the frontloading of reforms in some key areas in the context of the RRF should find their natural place in the Economic Complexity Index (ECI) theory (equally interesting are the Green Complexity Index (GCI) and Green Complexity Potential (GCP) theories) which should inform the implementation of national Recovery and Resilience Plans (RRPs) based on each EU member state’s sectorial and productive structure.
With billions of euros of grants and concessional loans to be spent across the EU, it is of paramount importance that investments and reforms are well targeted, growth-enhancing and build on a consolidated methodological framework in order to have a significant multiplier effect on the wider economy. This represents a crucial step to boost future economic growth and convergence in the EU, particularly for the less diversified member states in the Southern and South-Eastern EU Periphery. Here, we look at the implementation of the Greek Recovery and Resilience Plan (known as ‘Greece 2.0’) and evaluate the future use of EU Recovery Funds against the backdrop of the country’s product space and comparative advantages.
Complexity theories
According to economic complexity theory, countries tend to converge to the level of income dictated by the complexity of their productive structure. The concept of economic complexity is itself defined by a country’s national indicator (i.e. the Economic Complexity Index or ECI) measuring the capabilities and know-how embedded in the production of goods and services.
The index is calculated as a summary measure between a country’s diversification (the number of products that a country exports with a revealed comparative advantage) and a product’s ubiquity (the number of countries with revealed comparative advantages in that particular product). Economic growth is therefore driven by diversification into new products that are incrementally more complex and less ubiquitous. It follows that efforts from policy-makers should concentrate on creating the conditions that would allow complexity to favour sustained and long-term growth driven by a process of diversifying knowhow to produce a broader, and increasingly more complex, set of goods and services.
There is evidence that the ECI is a good predictor of economic growth over the long-term. In the context of the EU, the results suggest that economic convergence is much faster for countries whose exports are more complex than what should be expected for their income level.
Based on an extension of the concept of economic complexity, economists at the Institute for New Economic Thinking have more recently created a new measure which aims to capture the extent to which countries are able to export green and technologically sophisticated products in a competitive manner. Countries with high Green Complexity Indices (GCIs) tend to have significantly higher environmental patenting rates, lower CO2 emissions and more stringent environmental policies – even after controlling for their GDP per capita. Linked to the GCI is the concept of Green Complexity Potential (GCP), assessing each country’s average relatedness to green complex products which a country is not yet competitive in.
Economic complexity and the COVID-19 pandemic
The impact of the COVID shock in the EU has been extremely heterogeneous across countries and sectors, suggestive of a significant reallocation of resources as economies recover. It should come as no surprise that countries which had a diversified productive system and relative advantage in more sophisticated and tradable sectors fared comparatively better than others.
For instance, the digital and healthcare industries have performed well from the start of the pandemic; equally, enabling industries like chemicals and the agribusiness sector are experiencing a faster recovery. On the other hand, sectors dependent on human interaction, such as the transport services, tourism services, hospitality and catering industries, large sectors of retail trade and business delivering personal services, as well as cultural and creative industries, have suffered the most. In this sense, starting points and existing productive structure/product networks matter.
Figure 1: Country Economic Complexity Index ranking and ‘complexity frontier’ in the EU
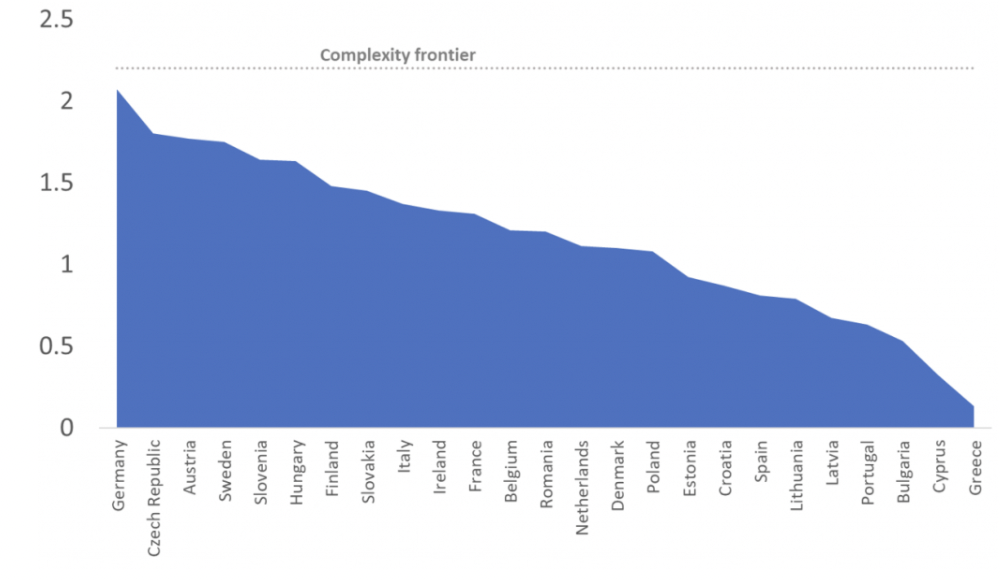
Note: The ‘complexity frontier’ is obtained as an average of the ECI for 2019 of Japan = 2.49; Switzerland = 2.13; Germany = 2.07. Source: Authors’ calculations based on Harvard Growth Lab’s Atlas of Economic Complexity Ranking: https://atlas.cid.harvard.edu/rankings. Missing data for Malta and Luxembourg.
Table 1: Country Complexity Index rankings and GDP per capita level
| EU Member State | Economic Complexity Index (ECI) 2019 | Evolution of ECI over 2014-19 | Economic Complexity Index (ECI) EU ranking in 2019 | Green Complexity Index (GCI) EU ranking in 2018 | Green Complexity Potential (GCP) EU ranking in 2018 | GDP per capita level in current USD in 2020 |
|---|---|---|---|---|---|---|
| Germany | 2.07 | -0.02 | 1 | 1 | 3 | 45,732 |
| Czech Republic | 1.80 | -0.02 | 2 | 5 | 8 | 22,578 |
| Austria | 1.77 | -0.04 | 3 | 3 | 5 | 48,154 |
| Sweden | 1.75 | -0.09 | 4 | 7 | 11 | 51,796 |
| Slovenia | 1.64 | 0.06 | 5 | 9 | 13 | 25,210 |
| Hungary | 1.63 | -0.03 | 6 | 11 | 16 | 15,820 |
| Finland | 1.48 | 0.15 | 7 | 12 | 21 | 48,981 |
| Slovakia | 1.45 | -0.09 | 8 | 17 | 20 | 19,071 |
| Italy | 1.37 | 0.02 | 9 | 2 | 1 | 31,288 |
| Ireland | 1.33 | 0.03 | 10 | 23 | 23 | 83,849 |
| France | 1.31 | -0.15 | 11 | 6 | 4 | 39,907 |
| Belgium | 1.21 | -0.03 | 12 | - | - | 44,529 |
| Romania | 1.20 | 0.02 | 13 | 15 | 15 | 12,797 |
| Netherlands | 1.11 | -0.04 | 14 | 21 | 9 | 52,247 |
| Denmark | 1.10 | -0.09 | 15 | 4 | 12 | 60,494 |
| Poland | 1.08 | -0.01 | 16 | 10 | 6 | 15,653 |
| Estonia | 0.92 | 0.04 | 17 | 14 | 17 | 23,330 |
| Croatia | 0.87 | 0.00 | 18 | 16 | 19 | 14,072 |
| Spain | 0.81 | -0.13 | 19 | 8 | 2 | 27,132 |
| Lithuania | 0.79 | 0.18 | 20 | 19 | 10 | 19,916 |
| Latvia | 0.67 | 0.05 | 21 | 20 | 18 | 17,559 |
| Portugal | 0.63 | 0.10 | 22 | 13 | 7 | 22,488 |
| Bulgaria | 0.53 | -0.07 | 23 | 18 | 14 | 9,919 |
| Cyprus | 0.32 | -0.17 | 24 | - | - | 27,053 |
| Greece | 0.13 | 0.02 | 25 | 22 | 22 | 17,670 |
Note: Missing data for Malta and Luxembourg for all ECI, GCI and GCP. Missing data for Belgium and Cyprus for GCI and GCP. Source: Harvard Growth Lab’s Atlas of Economic Complexity Ranking, INET Green Complexity and Potential Ranking, IMF WEO April 2021 Database.
Western and Northern EU member states generally rank higher based on economic complexity indicators, thanks to their product diversification in highly sophisticated sectors. Germany is ranked third globally and first among EU member states, with the global frontier being represented by the average of Japan, Switzerland and Germany (Figure 1).
By contrast, Central and Eastern European countries do not represent a homogenous block. The Czech Republic, Slovenia, Hungary and Slovakia are positioned relatively high in the ranking mainly due to their close export and investment flow linkages with Germany and its supply chains. Southern (Portugal, Spain, Cyprus and Greece), South-eastern (Bulgaria and Croatia) and Baltic (Latvia, Lithuania and Estonia) European countries still lag behind in terms of the complexity of their economies if compared with their Western, Northern and even some of their Eastern peers.
Where Southern European Countries performed comparatively better is in their Green Complexity Index (GCI) ranking and even more so their Green Complexity Potential (GCP) with Italy and Spain ranking first and second respectively, and Portugal ranked among the best performers. Countries such as the Netherlands with significantly higher GCP than GCI are particularly well-positioned for fast development of future green capabilities.
As there are remarkable differences in performance across EU countries, there are indeed differences across sectors and industries. In this sense, government support schemes in response to the pandemic had to be targeted at the sectors which have been the hardest hit. That happened through a combination of broad-based initiatives that were important for ensuring EU economies could rebound as quickly as possible from the crisis, without leaving too much scarring to their economies.
The standard narrative is that the uneven economic response to the common exogenous shock of the pandemic stems from three distinct factors: the different severity of lockdown measures; the different fiscal space of governments to counter the collapse in economic activity; and the uneven quality of corporate and public governance.
Yet, the productive structure and product complexity of individual national economies are important for understanding the uneven economic performance across the EU. Considering 2020 and 2021 cumulative annual GDP growth (Figure 2), countries with a less diversified industrial and export base, more reliance on tourism and less sophisticated industries (construction, hospitality, etc) such as Cyprus, Greece, Portugal, Spain, and Croatia have faced more severe output losses after the pandemic struck and are taking longer to recover. To a certain degree, as important as the level of economic complexity is, an important role is played by the rate at which complexity evolves over time. While the more mature EU economies have seen their complexity index remaining broadly stable or even decreasing slightly over time, most Central and Eastern European countries have seen an improvement in their complexity standing.
Figure 2: Economic complexity and GDP
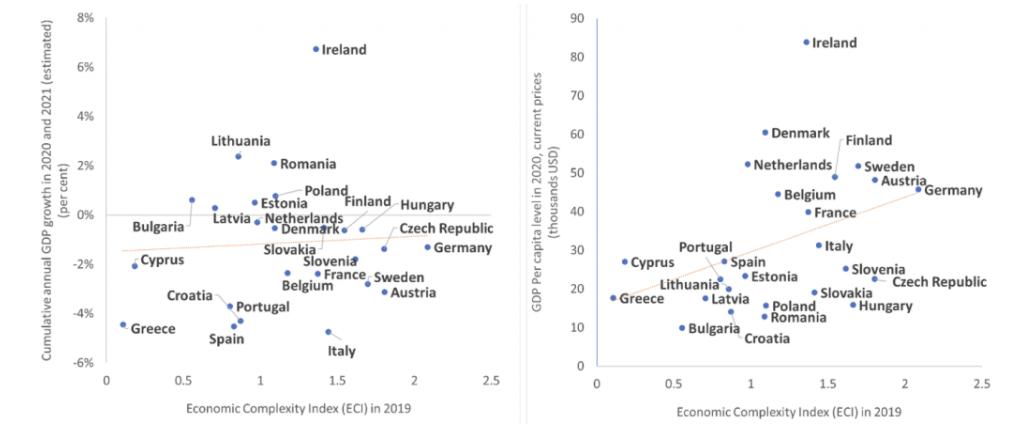
Source: Authors’ calculations based on Harvard Growth Lab’s Atlas of Economic Complexity Ranking & IMF WEO April 2021 Database.
The EU recovery funds as an opportunity to increase ‘complexity’
The EU’s broad-based response to the pandemic feeds into the debate on the limited fiscal European resources that were diverted to fight the Eurozone crisis, with markets left wondering whether public backstops would be enough to stop financial contagion.
Since 2020, EU member states and European financial institutions have put together several measures to cushion the immediate effects of the pandemic. These measures include the European Commission’s instrument for temporary ‘Support to mitigate Unemployment Risks in an Emergency’ (SURE), the ECB’s Pandemic Emergency Purchase Programme (PEPP), the ESM’s Pandemic Crisis Support, the EBRD’s Crisis COVID-19 Response, and the EIB’s Guarantee Fund mechanism (Figure 3), on top of national initiatives.
Figure 3: National and European crisis response and long-term recovery measures
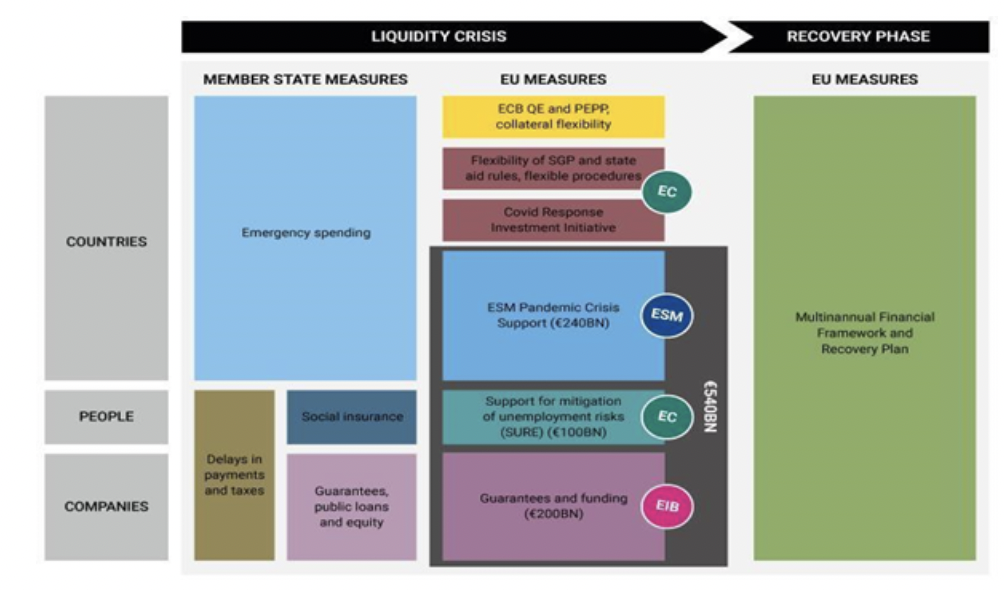
Source: European Commission
Against all odds, on 21 July 2020 EU leaders agreed on a EUR 750 billion (in 2018 prices) fiscal package, the Next Generation EU Programme, to top the EUR 1.07 trillion EU budget. The NGEU is exceptional as it prioritises reforms going beyond the temporary response to the economic fallout caused by the pandemic: truly, it represents a Hamiltonian moment for the EU. Some 80% of the resources will be channelled through the Recovery and Resilience Facility with each EU member state being able to claim EU grants and loans, based on a set of macroeconomic indicators, which aim to boost long-term public and private investments.
The design of the national Recovery and Resilience Plans and the future deployment of the RRF grants and loans – leveraging private sector financing and funding from the EBRD, EIB Group, and national financial institutions – will focus on longer-term strategic objectives and sectorial investments based on the industries of the future and the twin green and digital reform agendas. This ‘once in a lifetime’ investment opportunity should be targeted toward helping EU countries produce a broader and increasingly more complex set of goods and services. But will it?
Figure 4: Sum of Recovery and Resilience Facility grants and loans as a percentage of 2019 GNI as requested from EU member states as of August 2021
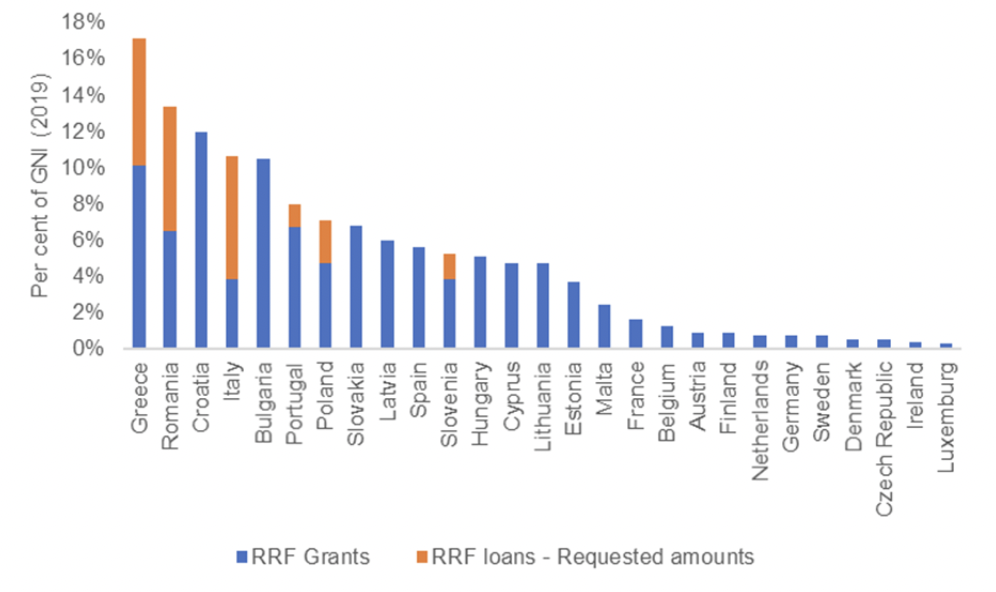
Source: Authors’ calculations based on European Commission and GNI World Bank data
Countries which are currently lagging in terms of complexity as measured by Harvard’s Growth Lab Economic Complexity Index (ECI) will be among the largest recipients of EU recovery funds as a percentage of their GNI (i.e., Greece, Croatia, Bulgaria, Portugal, Spain; Figure 4). Beneficiaries should increase the magnitude of this opportunity to help them catch up in terms of both economic complexity and their intra-EU convergence performance.
The EU is in dire need of pan-European infrastructure yielding economic spillover effects across countries and sectors from which the entire EU can benefit. Examples are high-speed railways, power grids to transport the electricity generated by renewable energy, infrastructure for green hydrogen, digital investments and 5G highways, but also human capital and mobility.
In order to do so, EU and national policymakers need to avoid financing existing projects with RRF funds and make full use of the RRF loans when justifiable. At the same time, governments should increase the often-limited administrative absorption capacity of the projects via technical assistance as well as target productive firms and long-term investments instead of using funding for short-term social transfers or tax cuts.
Greece 2.0
The majority of Greece’s goods exports are in low complexity products, such as minerals and agriculture, according to the Harvard Growth Lab’s Atlas of Economic Complexity. In their sample of 128 countries, Greece had the largest gap between the recorded level of income and the productive knowledge-content of its exports. For many years, especially before the European debt crisis struck in 2010, Greece owed its income mainly to borrowed foreign spending, historically producing few exports in machinery, electronics, and chemicals.
Figure 5: Greece’s product space in the Growth Lab’s ECI Index in 2019
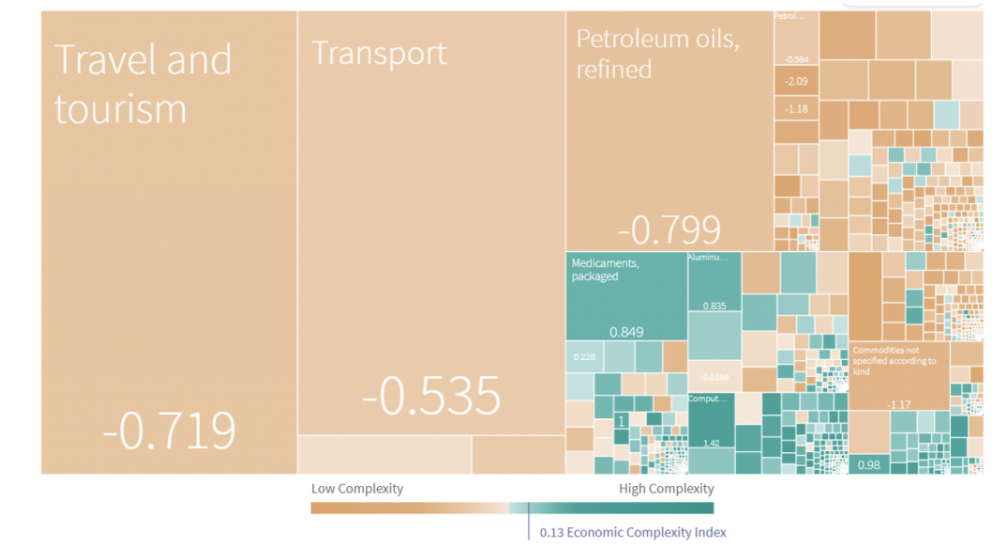
Source: Harvard Growth Lab’s Atlas of Economic Complexity Ranking: https://atlas.cid.harvard.edu/countries/90/export-complexity
Over the past decade, Greece has added 13 new goods products to its productive capacity, diversifying its economy into a few new manufactured goods but at too small a volume to contribute to substantial income growth. The recent addition in the Growth Lab’s Atlas of traded services has partly offered a more complete explanation of Greece’s economic growth dynamics, while also taking into account the relatively high-income for its low level of complexity (Figure 5).
Service products such as transport, tourism and travel services today represent over 50% of Greece’s exports. These products have accounted for the largest contribution to export growth in the country over the past decade. However, they have also suffered the most during the Greek sovereign debt crisis and, lately, the pandemic. Traded services explain a significant drag on Greece’s economic performance on both occasions.
The evidence shows that Greece’s existing know-how already affords many opportunities to diversify its structure into related products via a so-called Parsimonious Industrial Policy Approach to help jump short distances to nearby, more complex products. Importantly, Greece ranks first in the EU and second only to India on a global scale in the “distance” dimension, which measures how easy it would be for a country to move to export more complex goods.
Still, an analysis of the Greek Recovery and Resilience Plan and the findings of the “Development Plan for the Greek Economy” shows that one crucial feature of Greece’s poor economic performance in the past was low productivity and lack of complexity in its export basket. This is in line with previous findings.
In order to address Greece’s growth binding constraint while filling its large investment gap, public and private investments under Greece 2.0 will have to comply with five eligibility criteria: green transition; digitalisation; investments in R&D and innovation; extroversion; and economies of scale.
Upon the previous positive endorsement of the European Commission, the Greek plan has been already approved by the EU Council on 13 July as part of the first cohort of 12 ‘virtuous’ EU countries. The country’s authorities are currently in advanced discussions with international financial institutions and commercial banks for co-financing projects funded by 30.5 billion euros of EU RRF funds, of which 17.8 billion euros are in grants and 12.7 billion euros in loans, available for Greece until the end of 2026.
For instance, EU grants can be classified in relation to the EU flagship priorities for investment and reforms defined by the Commission. These include the categories shown in Table 2 below.
Table 2: Greek Recovery and Resilience Plan and EU flagship priorities for investment and reforms
| Modernise | At least 175m EUR will be allocated to investments to finance the acceleration of smart manufacturing, Industry 4.0 and new industrial parks. |
|---|---|
| Innovate | At least 440m EUR will be allocated to investments to finance innovative SMEs, mid-caps and corporates as well as R&D centres. |
| Power up | At least a billion EUR will be allocated to investments to finance the deployment of first generation renewable energy technologies (ie biomass and biogas plants, use of waste heat, electricity storage facilities, green hydrogen and energy storage) as well as the piloting of second generation technology. |
| Renovate | At least 2.4bn EUR will be allocated to finance investments in energy efficiency in buildings, environmental monitoring devices critical to the sustainable management of natural resources, water and waste management products. |
| Connect | At least 520m EUR will be allocated to investments to finance 5G network infrastructure along the major Greek highways, smart satellites and modern submarine fibre cables, as well as fibre optic infrastructure that is needed in residential and commercial buildings. |
| Recharge and refuel | At least 520m EUR will be allocated to investments to support the supply side of e-mobility, the recycling of electric car batteries, the production of electric vehicles and charging points CO2 storage vehicles. |
Note: Figures based on the Greek government’s Recovery and Resilience Plan.
While the classification above covers all the aspects in line with the EU green and digital targets, it does not say much about the interventions’ potential for product diversification and sophistication – and thus, whether Greece 2.0 will have a high chance of achieving the biggest bang for the buck.
Figure 6: Allocation of Recovery and Resilience Facility grants in economic sectors in Greece
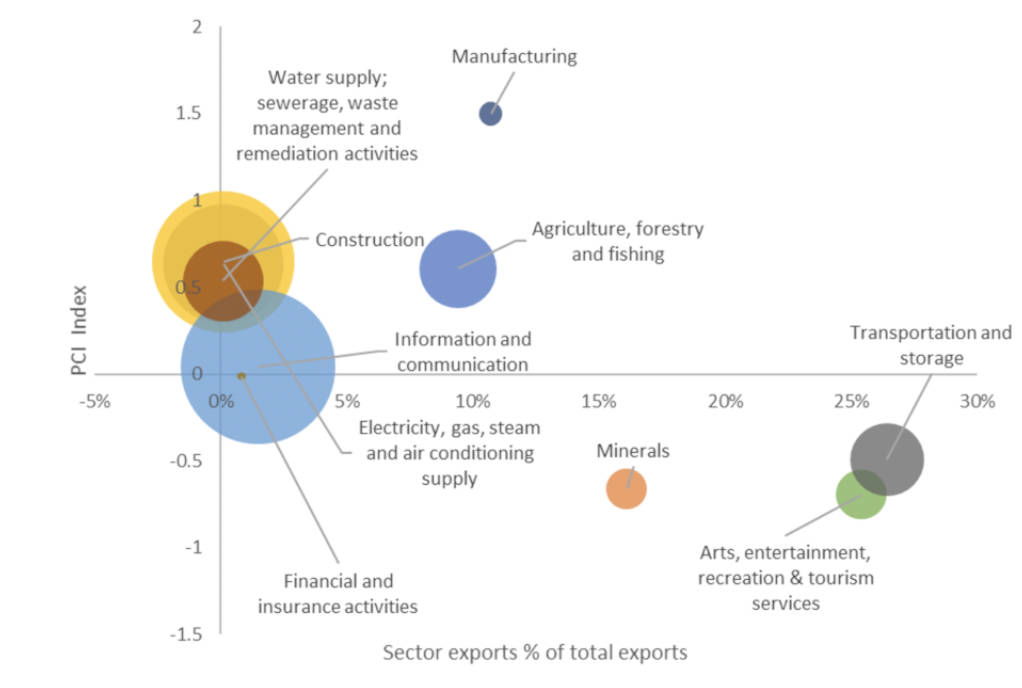
Note: The bubble size corresponds to the allocated amounts of RRF grants. Source: Authors’ calculations based on Harvard Growth Lab’s Atlas of Economic Complexity Ranking and Bruegel NACE calculations of the Green RR Plan.
Figure 6 compares the size of RRF grants which will flow to specific sectors (with specific investment priorities, as detailed in Greece 2.0) under the NACE classification system, with the Harvard Growth Lab PCI Index for the respective sectors (y-axis) and the percentage of sectorial exports out of Greece’s total export basket (x-axis).
It emerges that low-complexity traded service products such as transport, tourism and travel services, which represent a high share of Greece’s export basket, are set to receive a relatively minor contribution from RRF grants. On the other hand, digital investments in the ICT sector, as well as green investments in various sectors, will receive the lion’s share of the EU grants. An additional 12.7 billion euros will be disbursed from the Commission to the Greek government as RRF loans, which are intended to leverage equal amounts of private financing, in cooperation with European financial institutions such as the EBRD and EIB.
Loans from the EU, international financial institutions, and commercial banks, which will be deployed under the RRF Greek Corporate Loan Facility, should provide a further opportunity for the country to build on its current strengths to boost its industrial and export diversification. They will also potentially help Greece to substantially reallocate economic activity from low to high productivity and complexity sectors and products, such as electronics, advanced manufacturing, industrial machinery and the decarbonisation of the iron and steel industries. Luring potential new exporters by guaranteeing targeted investments in infrastructure, upskilling and R&D should equally be seen as a priority.
In conclusion, when looking through the lens of economic complexity theory, public and private investments should focus on those sectors able to support Greece’s long-term economic growth prospects and substantially help close the country’s product complexity gap with the EU frontier. To guarantee a sustainable strategy geared towards greater complexity, these investments, while remaining aligned with Europe’s strategic priorities of a green, digital and sustainable economy, will need to go above and beyond the European Commission’s agenda.
In our opinion, identifying the missing knowledge and infrastructural inputs required by new industries and assuring their provision could help the Greek recovery plan create the productive base for more economic resilience in the future.
The authors would like to thank Paul Mortimer-Lee and Barry Naisbitt for useful comments.
This post represents the views of the authors and not those of the COVID-19 blog, NIESR, the European Bank for Reconstruction and Development, nor LSE. It first appeared at LSE EUROPP.


