The decrease in UK exports in January made the headlines, but not enough attention has been paid to the evolution of UK exports to both EU and non-EU countries over time. Using ONS figures published since 1997, Cesar Revoredo-Giha analyses the evolution of export trends for food and drink products, frequently cited in the news as the focus of disruption by Brexit and the COVID-19 pandemic. He writes that trends in exports are the result of supply chain relationships between parts, something that requires trust, a long-term investment.
The news media has paid plenty of attention to the decrease in UK exports recorded in January with respect to the same month last year. According to figures published by the Office for National Statistics (ONS), total exports to the EU decreased by 44 per cent (using non-seasonal-adjusted figures) compared to exports to non-EU countries, which fell 18 per cent.
The reasons behind the decrease may be multiple, as each sector that comprises the export aggregate may have its own reasons, but for sure COVID-19 and Brexit are among the factors affecting cross-border trade. The ONS indicated several reasons for the result, such as disruption and stockpiling in the lead-up to the end of the UK-EU transition period; the ongoing impact of the pandemic, and global supply chain issues (ONS, 2021).
But whilst most of the attention has been paid to the latest export results, far less has been paid to trends driven by the evolution of UK exports to EU and non-EU countries over time. Trends are important because, in the case of businesses, they indicate if things are in the right trajectory and whether hiccups are just that.
The focus of this note is to observe the evolution of export trends, taking advantage of published ONS non-seasonal-adjusted monthly figures since 1997. Moreover, the focus will be on the export of food and drink products, as they have been frequently cited in the news as sectors in which both Brexit and the COVID-19 pandemic have created disruption.
Total food, live animals, and beverages
Figure 1 shows the export of food and live animals to EU and non-EU countries. The series has trend lines added to clarify exports evolution. Clearly the importance of the EU as a destination for UK food and live animal exports is highlighted by the data, reaching at times four times the exports to non-EU countries.
Figure 1. Exports to EU and non-EU countries – food and live animals
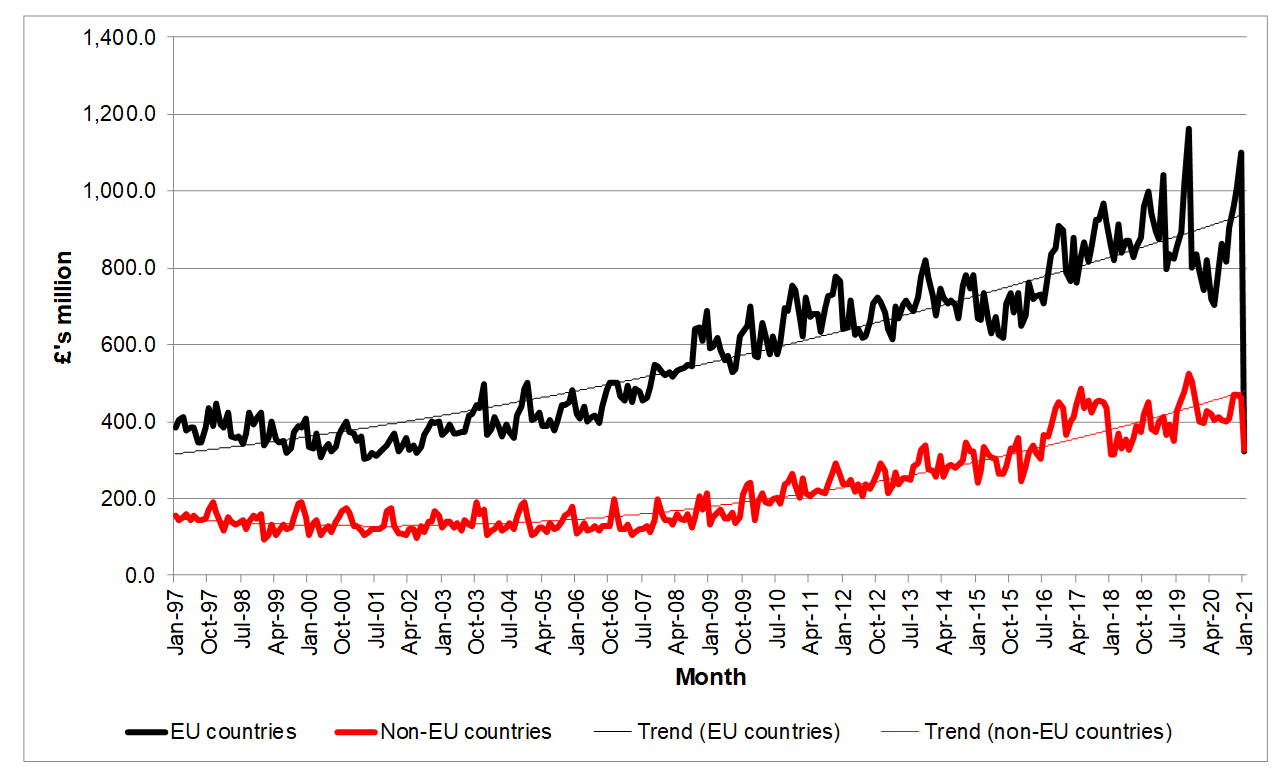
Source: Office for National Statistics. Note: Non-seasonal adjusted data.
The second thought that comes to one’s mind is that the exports to both destinations were doing fine (of course, up to January 2021) as they show steady increasing trends. Whilst until around 2007 the exports to the EU were growing much faster than those to non-EU countries, the latter caught up and despite the different levels both have been growing at a similar speed although still favouring EU destinations a bit.
Beverage exports (Figure 2) show the opposite situation to that of food and live animals. In the early 2000s exports to both EU and non-EU countries were very similar. But since then, whilst exports to the EU grew at a moderate pace, exports to non-EU countries (as shown by the trend line) has increased more rapidly, becoming, before Brexit, approximately twice the exports to the EU. Behind, this, of course, is the successful story of Scotch whisky. Figure 2 is also interesting because it shows that opening new markets is not an overnight story of free trade agreements. It requires building relationships between exporters and importers.
Figure 2: Exports to EU and non-EU countries – beverages
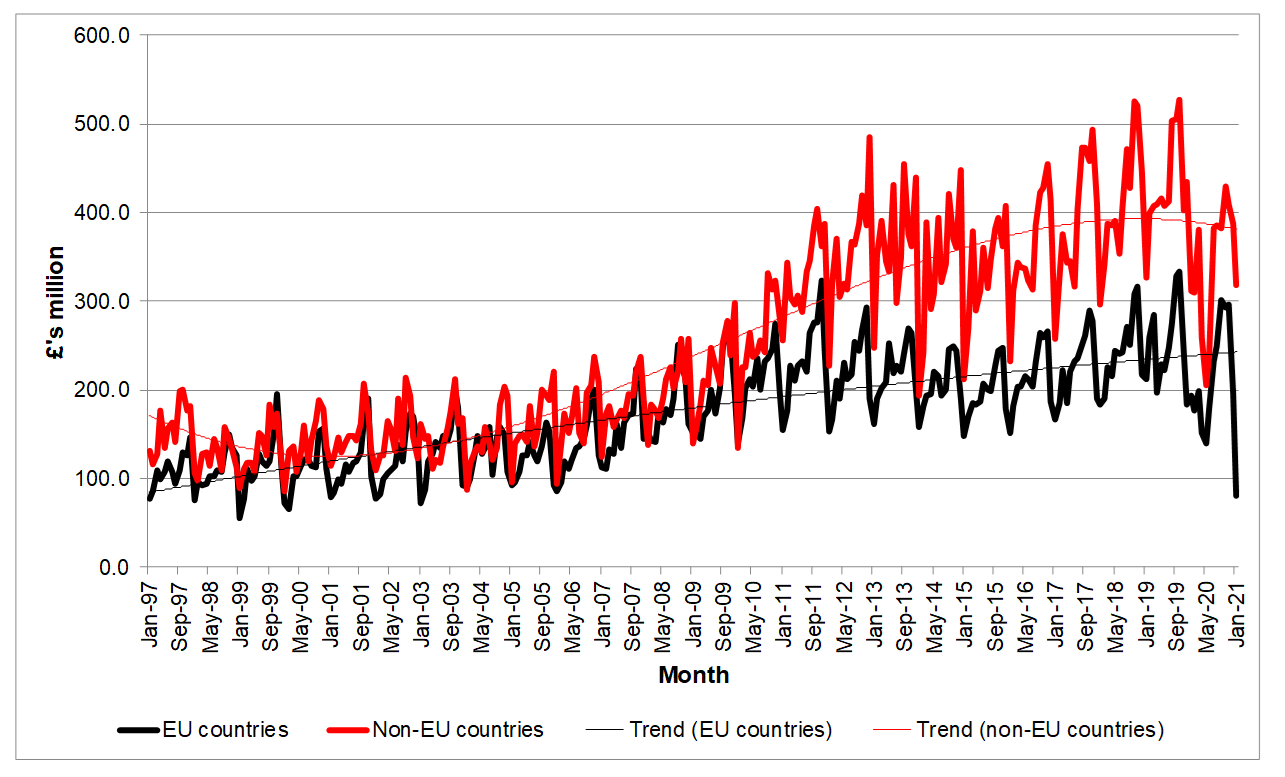
Source: Office for National Statistics. Note: Non-seasonal adjusted data.
Looking at individual food sectors
Figure 3 breaks down the food and live animal categories into 10 subcategories to allow us to see a more detailed picture of export trends and to what extent they match the aggregate data.
Figure 3. UK Exports to EU and non-EU countries by food sector
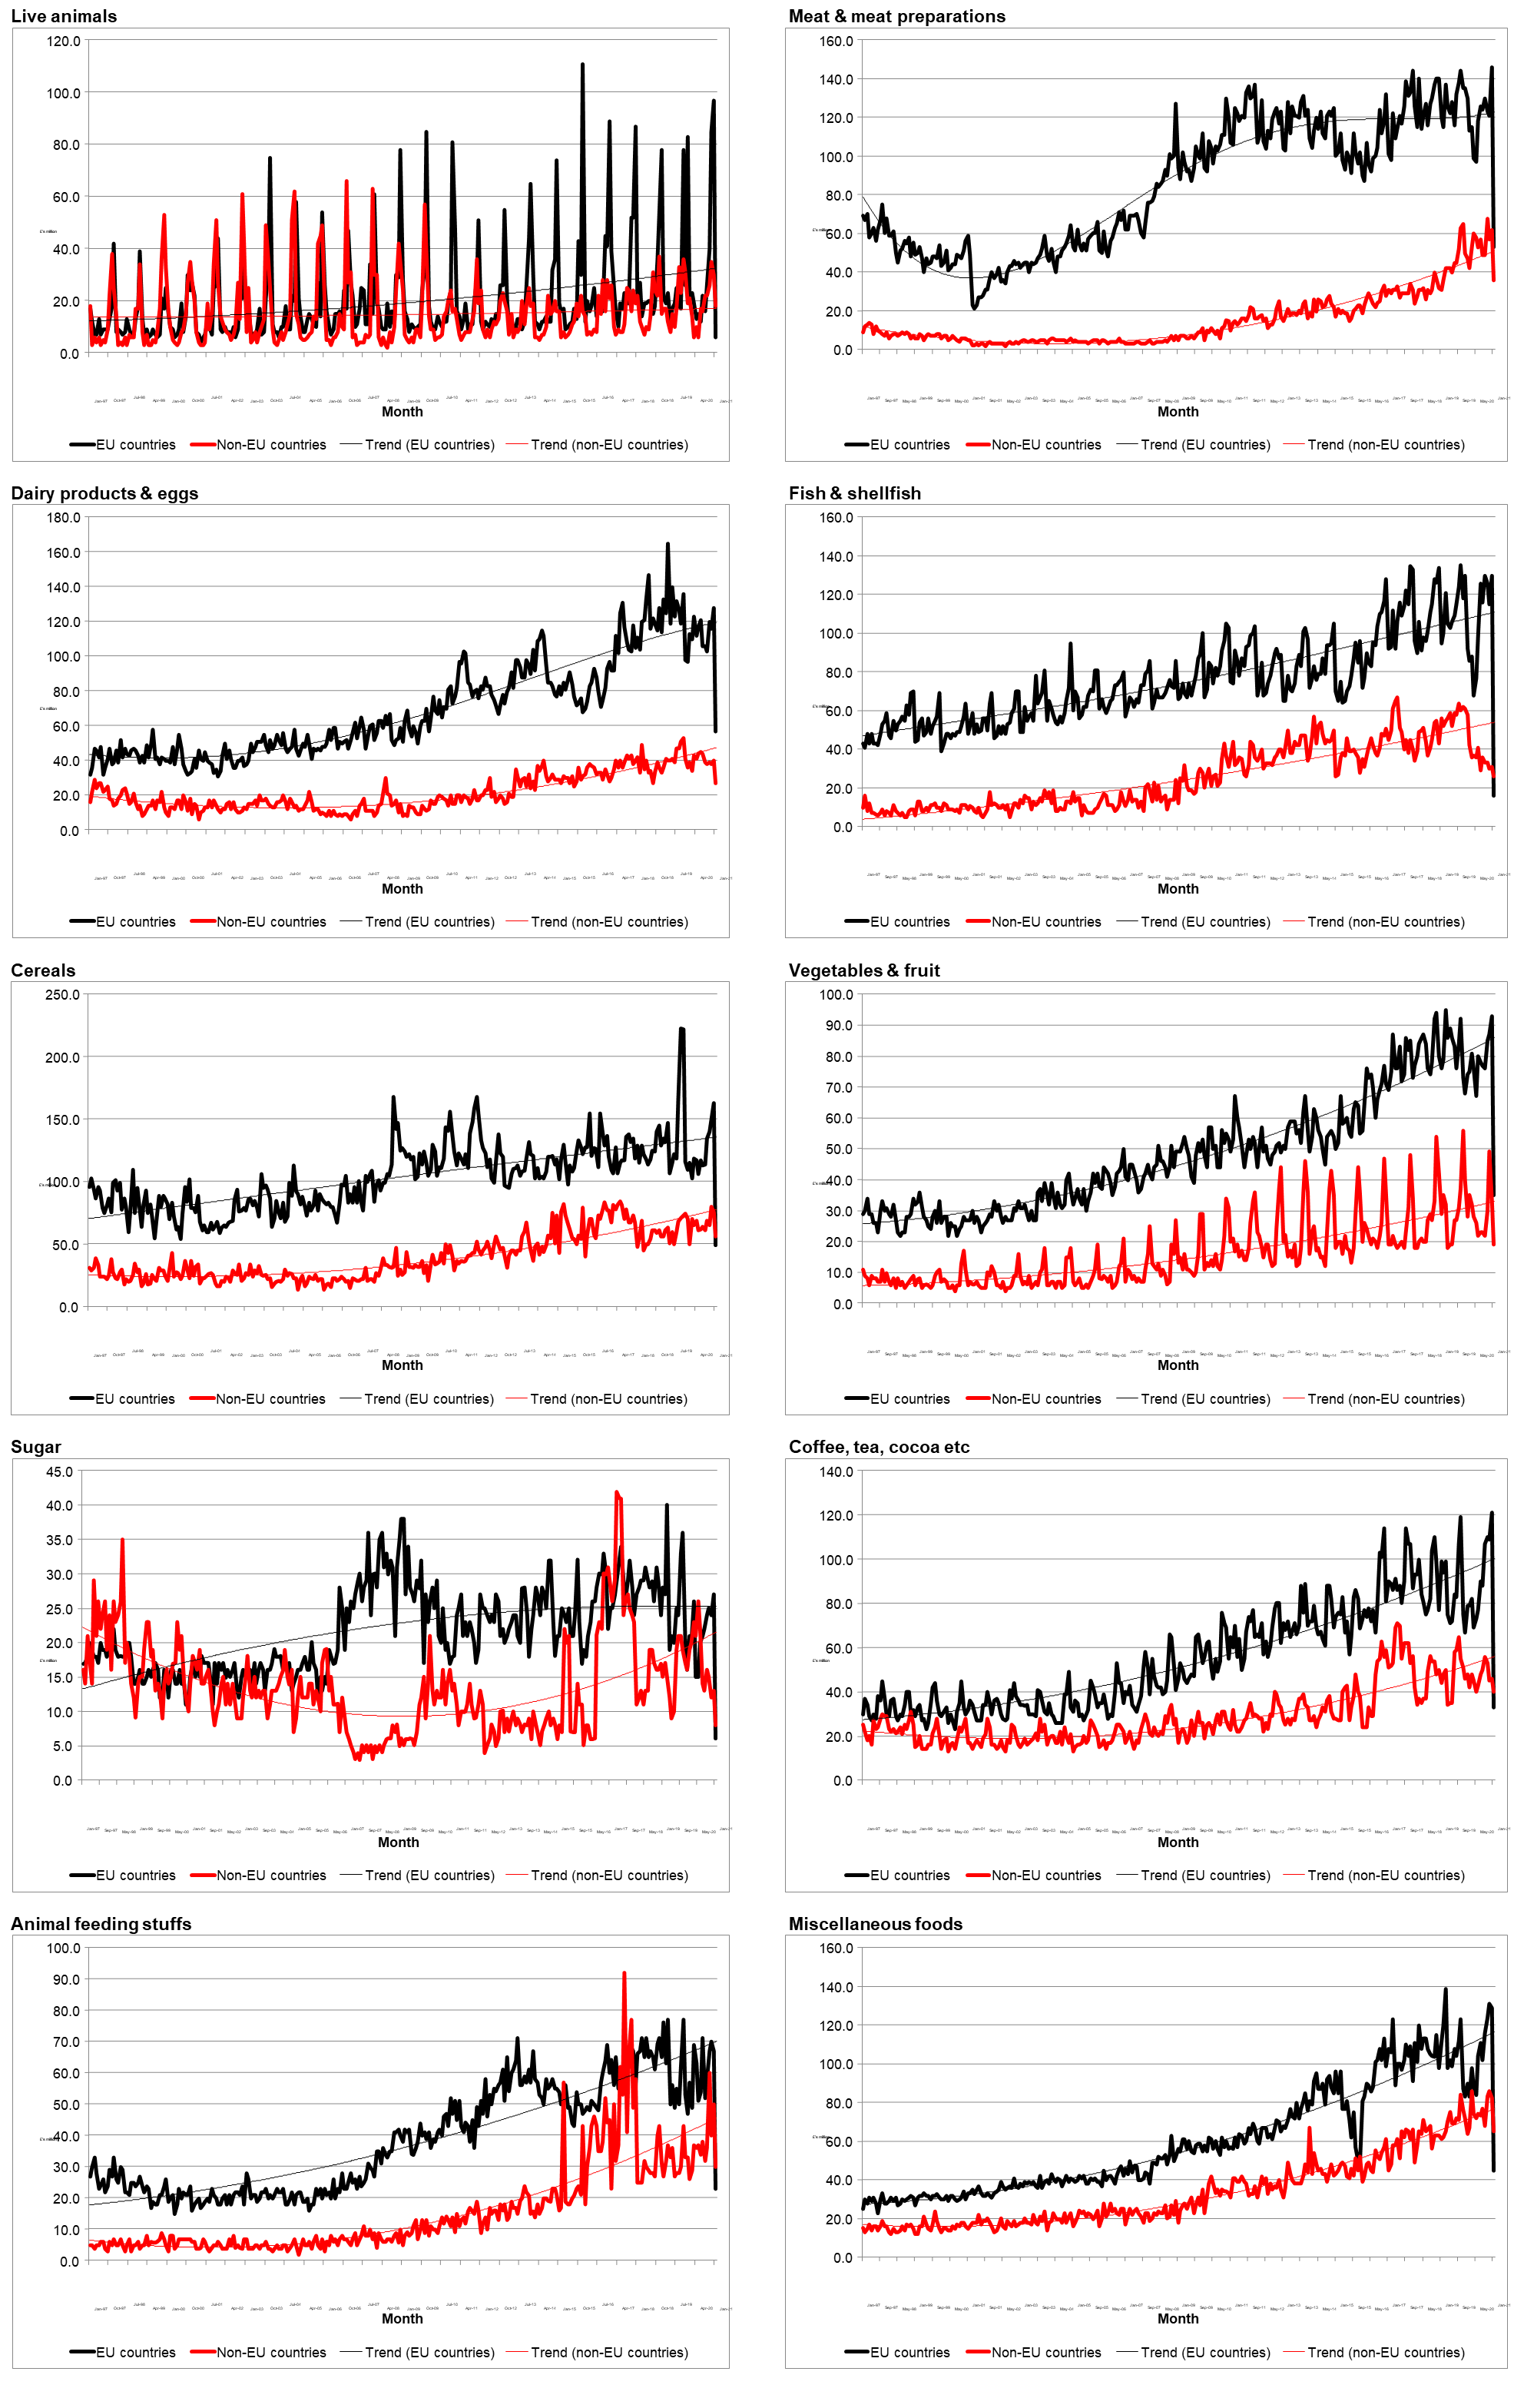
Source: Office for National Statistics. Note: Non-seasonal adjusted data.
The 10 subcategories shown in Figure 3 can be divided into three groups. The first one comprises most of them, i.e., meat and meat preparations; dairy production and eggs; fish and shellfish; cereals; vegetables and fruit; coffee, tea and cocoa; animal feeding stuffs; and miscellaneous foods. The second group includes exports of live animals and the third group, sugar exports.
The trends for the first group are like those observed for the aggregated group of food and live animals (Figure 1); these are steady increasing trends for both destinations (EU and non-EU) and the importance of exports to the EU on the total destinations.
Looking at the evolution of the sub-categories in the first group, it is not surprising that they have voiced their worry about the Brexit situation and any disruption of their EU markets. Looking at the data it is clear that UK exporters have slowly built these markets under the advantages of the EU single market, under common standards on animal welfare, safety and labelling. It is also important to highlight that these sectors did not disregard non-EU markets, as they also show an increasing trend.
Note that whatever happens with the exports of the first group has important regional repercussions (Food Manufacturer, 2021). For instance, salmon and beef are major Scottish exports. All the UK countries are exporters of lamb, a food item that is particularly important for some communities in Wales and Scotland. Dairy exports are particularly important for England.
The second group (live animals) shows increasing exports to the EU (but at a slower pace and with very high seasonality). Exports to non-EU countries are stable but without a growing trend. This group, however, will be affected by the ban of exporting live animals from Great Britain (The Guardian, 2020).
The third group, sugar exports, has had a more erratic evolution than the other sub-categories, with an increase of exports to the EU in 2007 (after the reform of the EU sugar sector) and later to the rest of the world in 2017.
What needs to be done?
It is important to remember that although trade is recorded between countries, it is actually done by entrepreneurs who look for market opportunities and in most of the cases when they find them, they do everything possible to cultivate them. Most of the reviewed data reflect this in the steady increase in exports to both EU and non-EU countries.
The observed trends in exports are the result of constant efforts to establish supply chains relationships between parts. These relationships are paved based on trust, which takes time to build, as it is an investment. It is important that this investment is not lost and the observed long-term trends are recovered despite the results of January 2021. For this, there is the need to reduce the frictions when dealing with our still main trade partner (e.g., unilateral measures).
Given the magnitude of exports to the EU, it is not possible to think that they can be easily replaced in the short term with free trade agreements in the food and drink sector. Moreover, several of the countries considered in these agreements, for instance the ‘Comprehensive and Progressive Agreement for Trans-Pacific Partnership’ (CPTPP) are net exporters of some of the products that the UK exports (i.e., they are competitors) such as salmon from Chile or lamb from New Zealand (Daily Brexit Update, 2021).
Finally, as mentioned, the effect of breaking the observed export trends can have significant regional impacts due to its effects on the income of rural areas and its multiplicative effects, which are key parts of economic and social sustainability.
♣♣♣
Notes:
- This blog post gives the views of its authors, not the position of LSE Business Review or the London School of Economics.
- Featured image by Ambitious Creative Co. – Rick Barrett on Unsplash
- When you leave a comment, you’re agreeing to our Comment Policy